GBP/JPY Price Analysis: Moves above 206.00 ahead of UK Autumn Budget

Source Fxstreet


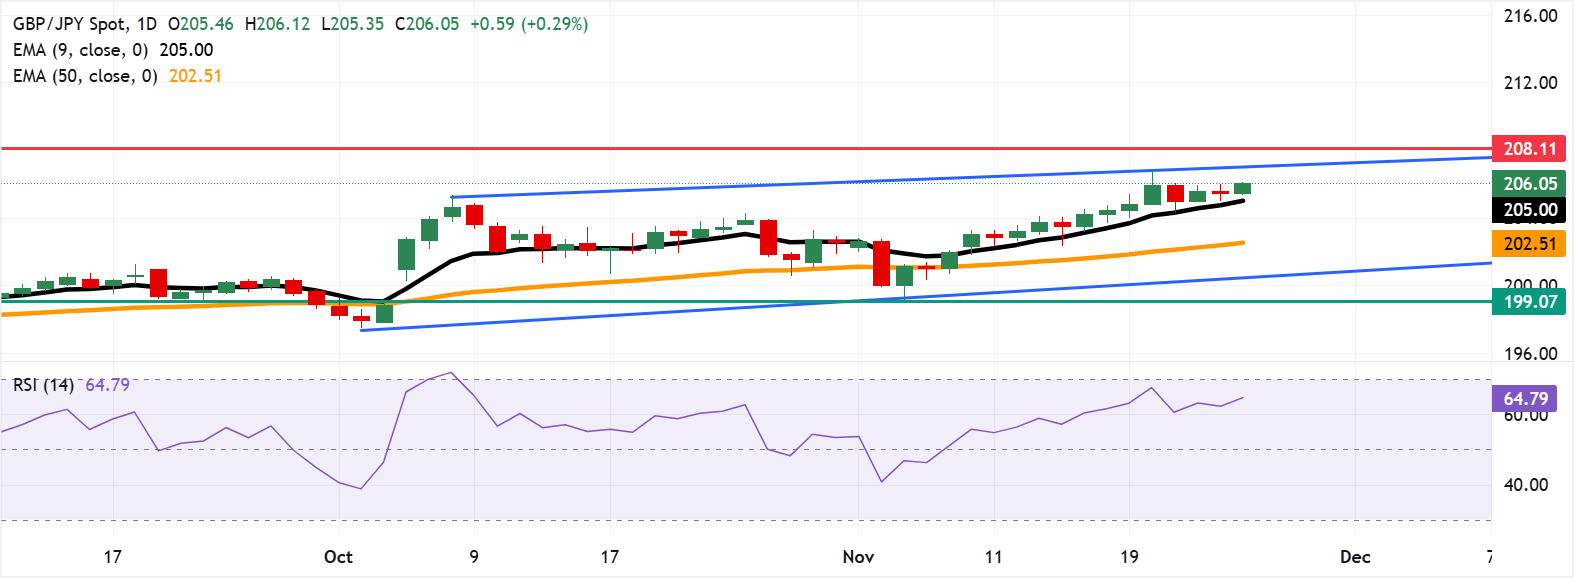
  • GBP/JPY may target the crucial level of 207.00, near the upper ascending channel boundary.
  • The 14-day Relative Strength Index has risen from 62.31 to 64.60, reinforcing the bullish momentum.
  • The primary support lies at the nine-day EMA of 205.00.

GBP/JPY gains nearly 0.25% after registering modest losses in the previous session, trading around 206.00 during the early European hours on Wednesday. Traders await the United Kingdom (UK) Chancellor of the Exchequer, Rachel Reeves, to deliver the Autumn Budget later in the day.

A look at the daily chart shows the currency cross is moving upwards within an ascending channel pattern, indicating a persistent bullish bias. Additionally, the 14-day Relative Strength Index (RSI), a key momentum gauge, has improved from 62.31 to 64.60, reinforcing positive momentum.

The GBP/JPY cross extends its advance above the rising nine- and 50-day Exponential Moving Averages (EMAs) at 205.00 and 202.51, respectively, keeping a bullish bias intact as the short-term average holds above the medium-term one.

The GBP/JPY cross may find its primary resistance at the psychological level of 207.00, followed by the ascending channel’s upper boundary at 207.10. A break above this level would support the currency cross to test the all-time high of 208.11, which was recorded in July 2024.

On the downside, the GBP/JPY cross may find its primary support at the nine-day EMA of 205.00. A break below the short-term moving average would prompt the currency cross to test the 50-day EMA of 202.51. Further support lies at the lower boundary of the ascending channel around 200.50, followed by an eight-week low of 199.07.

(The technical analysis of this story was written with the help of an AI tool.)

GBP/JPY: Daily Chart

Pound Sterling Price Today

The table below shows the percentage change of British Pound (GBP) against listed major currencies today. British Pound was the strongest against the Japanese Yen.

USD EUR GBP JPY CAD AUD NZD CHF
USD -0.10% -0.05% 0.19% -0.21% -0.46% -1.02% -0.21%
EUR 0.10% 0.06% 0.29% -0.09% -0.36% -0.90% -0.12%
GBP 0.05% -0.06% 0.25% -0.16% -0.42% -0.95% -0.17%
JPY -0.19% -0.29% -0.25% -0.40% -0.65% -1.18% -0.40%
CAD 0.21% 0.09% 0.16% 0.40% -0.27% -0.80% -0.01%
AUD 0.46% 0.36% 0.42% 0.65% 0.27% -0.54% 0.25%
NZD 1.02% 0.90% 0.95% 1.18% 0.80% 0.54% 0.79%
CHF 0.21% 0.12% 0.17% 0.40% 0.00% -0.25% -0.79%

The heat map shows percentage changes of major currencies against each other. The base currency is picked from the left column, while the quote currency is picked from the top row. For example, if you pick the British Pound from the left column and move along the horizontal line to the US Dollar, the percentage change displayed in the box will represent GBP (base)/USD (quote).

Disclaimer: For information purposes only. Past performance is not indicative of future results.
placeholder
Top 3 Price Prediction: Bitcoin, Ethereum, Ripple – BTC, ETH and XRP Look for a Foothold After a Sharp ShakeoutBitcoin trades near $92,600 after a dip below $90,000, while Ethereum around $3,118 and XRP near $2.21–$2.23 sit on key support zones, as BTC, ETH and XRP all try to turn a sharp correction into a tradable rebound rather than a deeper slide.
Author  Mitrade
Nov 19, Wed
Bitcoin trades near $92,600 after a dip below $90,000, while Ethereum around $3,118 and XRP near $2.21–$2.23 sit on key support zones, as BTC, ETH and XRP all try to turn a sharp correction into a tradable rebound rather than a deeper slide.
placeholder
Bitcoin Volatility Spikes: Is Options-Driven Pricing Making a Comeback?Bitcoin's volatility is surging, suggesting a shift back to options-driven price action seen before Bitcoin ETFs were launched.
Author  Mitrade
Nov 24, Mon
Bitcoin's volatility is surging, suggesting a shift back to options-driven price action seen before Bitcoin ETFs were launched.
placeholder
2025 Black Friday is coming! Which stocks may see volatility?Coming on the day right after Thanksgiving in the United States, Back Friday marks the start of the holiday shopping season. Sales data from this shopping frenzy day reflects investor confidence and consumer trends. The National Retail Federation (NRF) predicts that holiday season (Nov and Dec) retail sales in 2025 will likely exceed $1 trillion for the very first time, which represents a year-over-year increase of 3.7 to 4.2 percent. Historic data from the past decade show that the retail sector has generally outperformed the S&P 500 during the weeks before and after Black Friday. The following retailing companies are expected to be big winners:
Author  Insights
Nov 24, Mon
Coming on the day right after Thanksgiving in the United States, Back Friday marks the start of the holiday shopping season. Sales data from this shopping frenzy day reflects investor confidence and consumer trends. The National Retail Federation (NRF) predicts that holiday season (Nov and Dec) retail sales in 2025 will likely exceed $1 trillion for the very first time, which represents a year-over-year increase of 3.7 to 4.2 percent. Historic data from the past decade show that the retail sector has generally outperformed the S&P 500 during the weeks before and after Black Friday. The following retailing companies are expected to be big winners:
placeholder
Gold Price Forecast: XAU/USD rises to near $4,150 as Fed rate cut bets growGold price (XAU/USD) attracts some buyers to around $4,140 during the early Asian session on Tuesday. The precious metal rises on growing expectations of a US Federal Reserve (Fed) interest rate cut in the December policy meeting.
Author  FXStreet
Yesterday 01: 29
Gold price (XAU/USD) attracts some buyers to around $4,140 during the early Asian session on Tuesday. The precious metal rises on growing expectations of a US Federal Reserve (Fed) interest rate cut in the December policy meeting.
placeholder
Bitcoin Price Rebound Gains Traction with $90K Break in SightBitcoin is trading above $87,000 and its 100-hour SMA after rebounding from $83,500, with a bearish trend line at $88,200 and resistance at $89,000–$90,000 now in focus as BTC either breaks higher toward $91,750–$94,000 or slips back toward $86,700, $85,000 and lower supports.
Author  Mitrade
6 hours ago
Bitcoin is trading above $87,000 and its 100-hour SMA after rebounding from $83,500, with a bearish trend line at $88,200 and resistance at $89,000–$90,000 now in focus as BTC either breaks higher toward $91,750–$94,000 or slips back toward $86,700, $85,000 and lower supports.
goTop
quote