

Australian Dollar declines ahead of looming complete monthly CPI
- The Australian Dollar loses despite a cautious RBA tone.
- Australia’s first “complete” monthly CPI release on Wednesday is expected to provide fresh momentum for shaping RBA policy.
- The CME FedWatch Tool indicates pricing in a 69% chance of a 25-basis-point Fed rate cut in December.
The Australian Dollar (AUD) edges lower against the US Dollar (USD) on Monday ahead of the looming key inflation update this week. Traders will likely observe Australia’s first “complete” monthly CPI on Wednesday for October to gain further impetus regarding the Reserve Bank of Australia (RBA) monetary policy.
The AUD/USD pair, however, received support as the AUD gained on growing expectations of an RBA cautious stance. Minutes from the RBA’s November meeting indicated the central bank may keep rates unchanged for an extended period. ASX 30-Day Interbank Cash Rate Futures show that as of November 20, the December 2025 contract traded at 96.41, implying a 6% probability of a rate cut to 3.35% from 3.60% at the upcoming RBA Board meeting.
RBA Assistant Governor Sarah Hunter noted on Thursday that “sustained above-trend growth could fuel inflationary pressures.” Hunter noted that monthly inflation data can be volatile and that the central bank won’t react to a single month of figures. She added that the RBA is closely assessing labor-market conditions to gauge supply capacity and is examining how the effects of monetary policy may be changing over time.
US Dollar slides as Fed rate-cut bets resurface
- The US Dollar Index (DXY), which measures the value of the US Dollar (USD) against six major currencies, is halting its five-day winning streak and trading around 100.10 at the time of writing. The Greenback weakens as renewed expectations of a Fed rate cut in December weigh on sentiment.
- The CME FedWatch Tool suggests that markets are now pricing in a 69% chance that the Fed will cut its benchmark overnight borrowing rate by 25 basis points (bps) at its December meeting, up from 44% probability that markets priced a week ago.
- New York Fed President John Williams said on Friday that policymakers could still cut rates in the “near-term,” a remark that lifted market odds for a December move. Moreover, Fed Governor Stephen Miran said that Nonfarm Payrolls data supports a December rate cut, adding that if his vote were decisive, he “would vote for a 25-bps cut.”
- The University of Michigan’s (UoM) Consumer Sentiment Index rose in November to 51 from a preliminary 50.3, beating forecasts but posting a decline from October's reading of 53.6. Inflation expectations improved, with the one-year outlook easing to 4.5% from 4.7% and the five-year measure falling to 3.4% from 3.6%.
- Nonfarm Payrolls (NFP) in the United States (US) rose by 119,000 in September, compared to the 4,000 decrease (revised from +22,000) recorded in August. This figure surpassed the market expectation of 50,000. The US Unemployment Rate ticked up to 4.4% in September from 4.3% in August. The Average Hourly Earnings held steady at 3.8% YoY, compared to the market expectation of 3.7%.
- FOMC Minutes for the October 28-29 meeting indicated that Fed officials are divided and cautious about the path forward for interest rates. Most participants indicated further rate cuts would likely be appropriate over time, but several indicated they did not necessarily view a reduction in December as appropriate.
- The preliminary reading of Australia's S&P Global Manufacturing Purchasing Managers Index (PMI) came in at 51.6 in November, versus 49.7 prior. Meanwhile, Services PMI rose to 52.7 in November from the previous reading of 52.5, while the Composite PMI increased to 52.6 in November versus 52.1 prior.
- The Reserve Bank of Australia published the Minutes of its November monetary policy meeting on Tuesday, indicating that board members signalled a more balanced policy stance, adding that it could keep the cash rate unchanged for longer if incoming data proves stronger than expected.
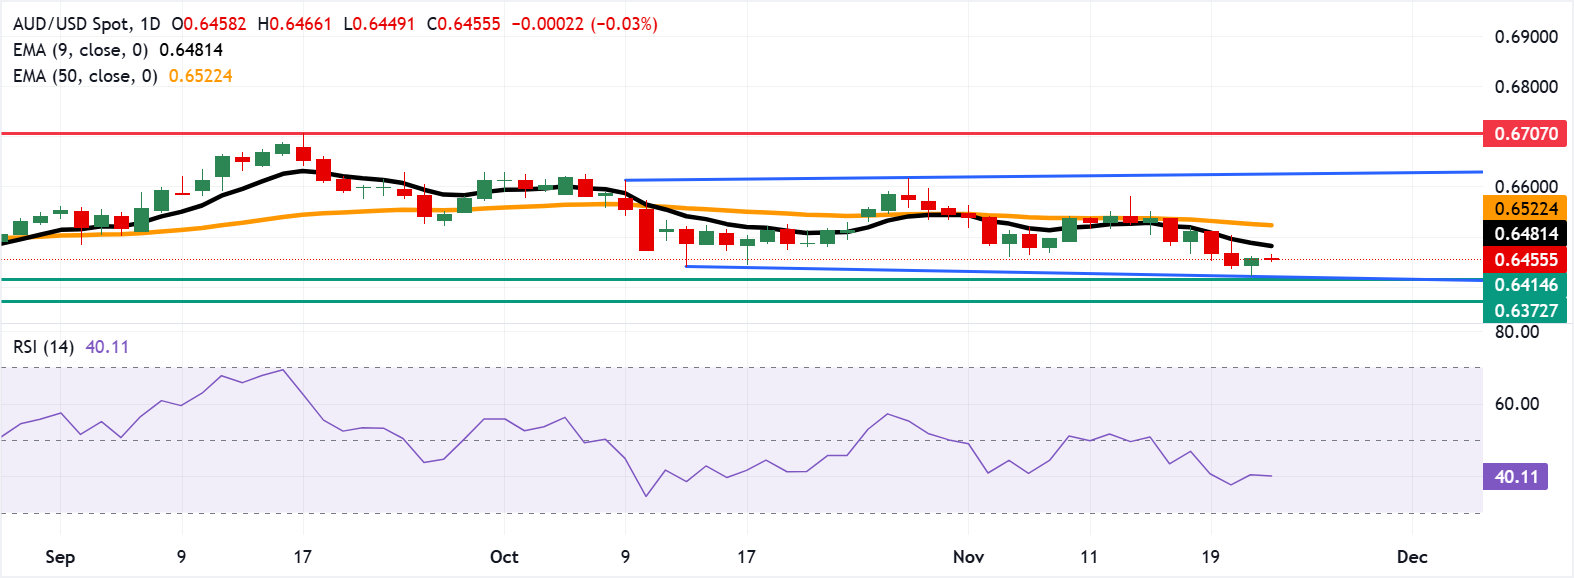
Australian Dollar hovers near 0.6450 within a consolidation phase
The AUD/USD pair is trading around 0.6450 on Monday. The daily chart shows the pair trading sideways within a rectangular range, reflecting a phase of price consolidation. Meanwhile, the price continues to hold below the nine-day Exponential Moving Average (EMA), indicating subdued short-term momentum.
The AUD/USD pair finds immediate support at the lower boundary of the rectangle around 0.6420, followed by the five-month low of 0.6414, which was recorded on August 21.
On the upside, the primary barrier lies at the nine-day EMA of 0.6481, followed by the psychological level of 0.6500. A break above this level would improve the short-term price momentum and lead the pair to reach the rectangle’s upper boundary near 0.6620.
Australian Dollar Price Today
The table below shows the percentage change of Australian Dollar (AUD) against listed major currencies today. Australian Dollar was the weakest against the US Dollar.
| USD | EUR | GBP | JPY | CAD | AUD | NZD | CHF | |
|---|---|---|---|---|---|---|---|---|
| USD | 0.02% | 0.08% | 0.19% | 0.05% | 0.00% | 0.05% | 0.10% | |
| EUR | -0.02% | 0.06% | 0.16% | 0.02% | -0.02% | 0.03% | 0.08% | |
| GBP | -0.08% | -0.06% | 0.10% | -0.03% | -0.07% | -0.04% | 0.02% | |
| JPY | -0.19% | -0.16% | -0.10% | -0.13% | -0.17% | -0.13% | -0.07% | |
| CAD | -0.05% | -0.02% | 0.03% | 0.13% | -0.04% | -0.00% | 0.06% | |
| AUD | -0.01% | 0.02% | 0.07% | 0.17% | 0.04% | 0.04% | 0.10% | |
| NZD | -0.05% | -0.03% | 0.04% | 0.13% | 0.00% | -0.04% | 0.06% | |
| CHF | -0.10% | -0.08% | -0.02% | 0.07% | -0.06% | -0.10% | -0.06% |
The heat map shows percentage changes of major currencies against each other. The base currency is picked from the left column, while the quote currency is picked from the top row. For example, if you pick the Australian Dollar from the left column and move along the horizontal line to the US Dollar, the percentage change displayed in the box will represent AUD (base)/USD (quote).
Australian Dollar FAQs
One of the most significant factors for the Australian Dollar (AUD) is the level of interest rates set by the Reserve Bank of Australia (RBA). Because Australia is a resource-rich country another key driver is the price of its biggest export, Iron Ore. The health of the Chinese economy, its largest trading partner, is a factor, as well as inflation in Australia, its growth rate and Trade Balance. Market sentiment – whether investors are taking on more risky assets (risk-on) or seeking safe-havens (risk-off) – is also a factor, with risk-on positive for AUD.
The Reserve Bank of Australia (RBA) influences the Australian Dollar (AUD) by setting the level of interest rates that Australian banks can lend to each other. This influences the level of interest rates in the economy as a whole. The main goal of the RBA is to maintain a stable inflation rate of 2-3% by adjusting interest rates up or down. Relatively high interest rates compared to other major central banks support the AUD, and the opposite for relatively low. The RBA can also use quantitative easing and tightening to influence credit conditions, with the former AUD-negative and the latter AUD-positive.
China is Australia’s largest trading partner so the health of the Chinese economy is a major influence on the value of the Australian Dollar (AUD). When the Chinese economy is doing well it purchases more raw materials, goods and services from Australia, lifting demand for the AUD, and pushing up its value. The opposite is the case when the Chinese economy is not growing as fast as expected. Positive or negative surprises in Chinese growth data, therefore, often have a direct impact on the Australian Dollar and its pairs.
Iron Ore is Australia’s largest export, accounting for $118 billion a year according to data from 2021, with China as its primary destination. The price of Iron Ore, therefore, can be a driver of the Australian Dollar. Generally, if the price of Iron Ore rises, AUD also goes up, as aggregate demand for the currency increases. The opposite is the case if the price of Iron Ore falls. Higher Iron Ore prices also tend to result in a greater likelihood of a positive Trade Balance for Australia, which is also positive of the AUD.
The Trade Balance, which is the difference between what a country earns from its exports versus what it pays for its imports, is another factor that can influence the value of the Australian Dollar. If Australia produces highly sought after exports, then its currency will gain in value purely from the surplus demand created from foreign buyers seeking to purchase its exports versus what it spends to purchase imports. Therefore, a positive net Trade Balance strengthens the AUD, with the opposite effect if the Trade Balance is negative.
Recommended Articles


