GBP/USD steadies as Trump tones down China rhetoric; eyes on US CPI
- GBP/USD holds firm as Trump softens stance on China.
- Fed blackout period and 20-day US shutdown keep focus on political headlines.
- Analysts warns UK services inflation could undershoot BoE’s forecast, adding slight dovish pressure
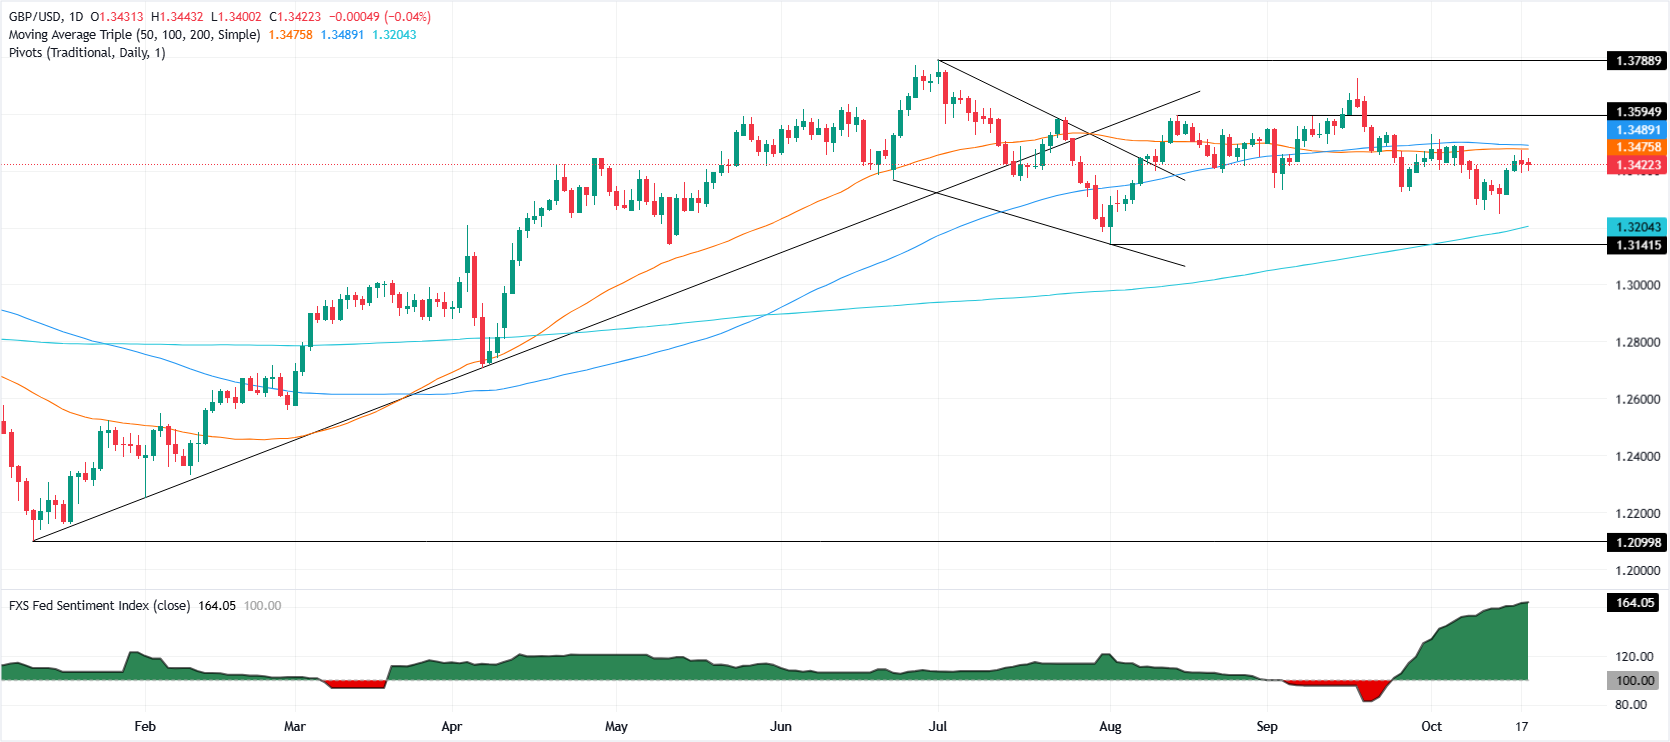
The GBP/USD remains steady during the North American session after three straight days of gains, as the Greenback recovers on Trump’s softening his rhetoric on China. At the time of writing, the pair trades at 1.3425 after hitting a daily high of 1.3442.
Sterling pauses three-day rally on firm US Dollar as markets brace for US CPI print
The US economic docket remains absent, with traders waiting for the release of the Consumer Price Index (CPI) for September on October 24 at 8:30 AM ET. Also, Federal Reserve officials began its blackout period and with the government shutdown extending to its twentieth day, market players will be keen to US President Donald Trump’s activity on social media.
Bloomberg reported that Trump is listing top demands on China, mainly rare earths, fentanyl and soybeans. He said that he wants China to stop fentanyl and resume soybean purchases.
Later this week, the US and China will meet in Malaysia amid a fragile trade truce November 10 deadline looms, unless it is extended by both countries.
Meanwhile, analysts at ING suggested that UK’s services inflation could undershoot the Bank of England’s (BoE) projection. ING forex strategist Francesco Pesole said, “That (inflation data) can modestly move the needle to the dovish side in the British swap curve and weigh on the pound this week.”
Last week’s soft readings on UK employment increased speculation that labor market loosening could weigh on Sterling as the BoE could be leaning slightly dovish, despite market players pricing in the next rate cut until March 2026.
GBP/USD Price Forecast: Technical outlook
The GBP/USD is poised to trade within the 1.3400–1.3443 band, with the 50-day SMA capping upside at 1.3472 ahead of the 1.3500 print. On the downside, the 20-day SMS is first support at 1.3411 followed by the 1.3400 figure, with further downside seen if the label gives way.
The next key supports are October 15 daily low of 1.3309, followed by the October 14 swing low of 1.3248.

Pound Sterling Price Today
The table below shows the percentage change of British Pound (GBP) against listed major currencies today. British Pound was the strongest against the Canadian Dollar.
| USD | EUR | GBP | JPY | CAD | AUD | NZD | CHF | |
|---|---|---|---|---|---|---|---|---|
| USD | -0.04% | 0.03% | -0.05% | 0.06% | -0.34% | -0.42% | -0.26% | |
| EUR | 0.04% | 0.08% | -0.04% | 0.08% | -0.30% | -0.40% | -0.21% | |
| GBP | -0.03% | -0.08% | -0.10% | 0.00% | -0.38% | -0.47% | -0.29% | |
| JPY | 0.05% | 0.04% | 0.10% | 0.11% | -0.27% | -0.43% | -0.20% | |
| CAD | -0.06% | -0.08% | -0.00% | -0.11% | -0.32% | -0.48% | -0.30% | |
| AUD | 0.34% | 0.30% | 0.38% | 0.27% | 0.32% | -0.11% | 0.08% | |
| NZD | 0.42% | 0.40% | 0.47% | 0.43% | 0.48% | 0.11% | 0.18% | |
| CHF | 0.26% | 0.21% | 0.29% | 0.20% | 0.30% | -0.08% | -0.18% |
The heat map shows percentage changes of major currencies against each other. The base currency is picked from the left column, while the quote currency is picked from the top row. For example, if you pick the British Pound from the left column and move along the horizontal line to the US Dollar, the percentage change displayed in the box will represent GBP (base)/USD (quote).

