
GBP/JPY slips as UK fiscal concerns weigh, BoJ hike bets firm
- GBP/JPY retreats 0.27% to 199.72 after rejection near 200.34 weekly high.
- UK debt auction shows weaker demand, stoking fiscal worries ahead of Reeves’ November 2026 autumn budget.
- BoJ minutes flagged scope for hikes if outlook holds; markets price 72% chance of 25-bps move this year.
The Pound Sterling losses ground versus the Japanese Yen on Thursday as the cross-pair reversed its course from around weekly highs of 200.34, weighed by investors growing concerns about Britain finances. The GBP/JPY trades at 199.72, down 0.27%.
Sterling pressured by soft Gilt demand; Yen supported by BoJ minutes, Tokyo CPI in focus
Reuters revealed that the latest 2034 Gilt auction revealed that investor demand for UK’s debt, has softened. Chancellor Rachel Reeves would reveal the autumn budget in November 2026, which is expected to show a balance between raising taxes and supporting economic growth.
Bank of England MPC members Megan Greene was hawkish on Wednesday, said that she is less concerned about a decline in the labor market. She added that risks from trade persisted but had faded, while inflation risks are tilted to the upside.
In Japan, the minutes of the Bank of Japan’s from two meetings ago, discussed the case for future rate hikes, if the economic and price outlooks adhered to projections. In the meantime, market participants had priced in a 72% chance of a 25-bps rate hike by year end. Traders’ eyes will shift to the release of Tokyo CPI data.
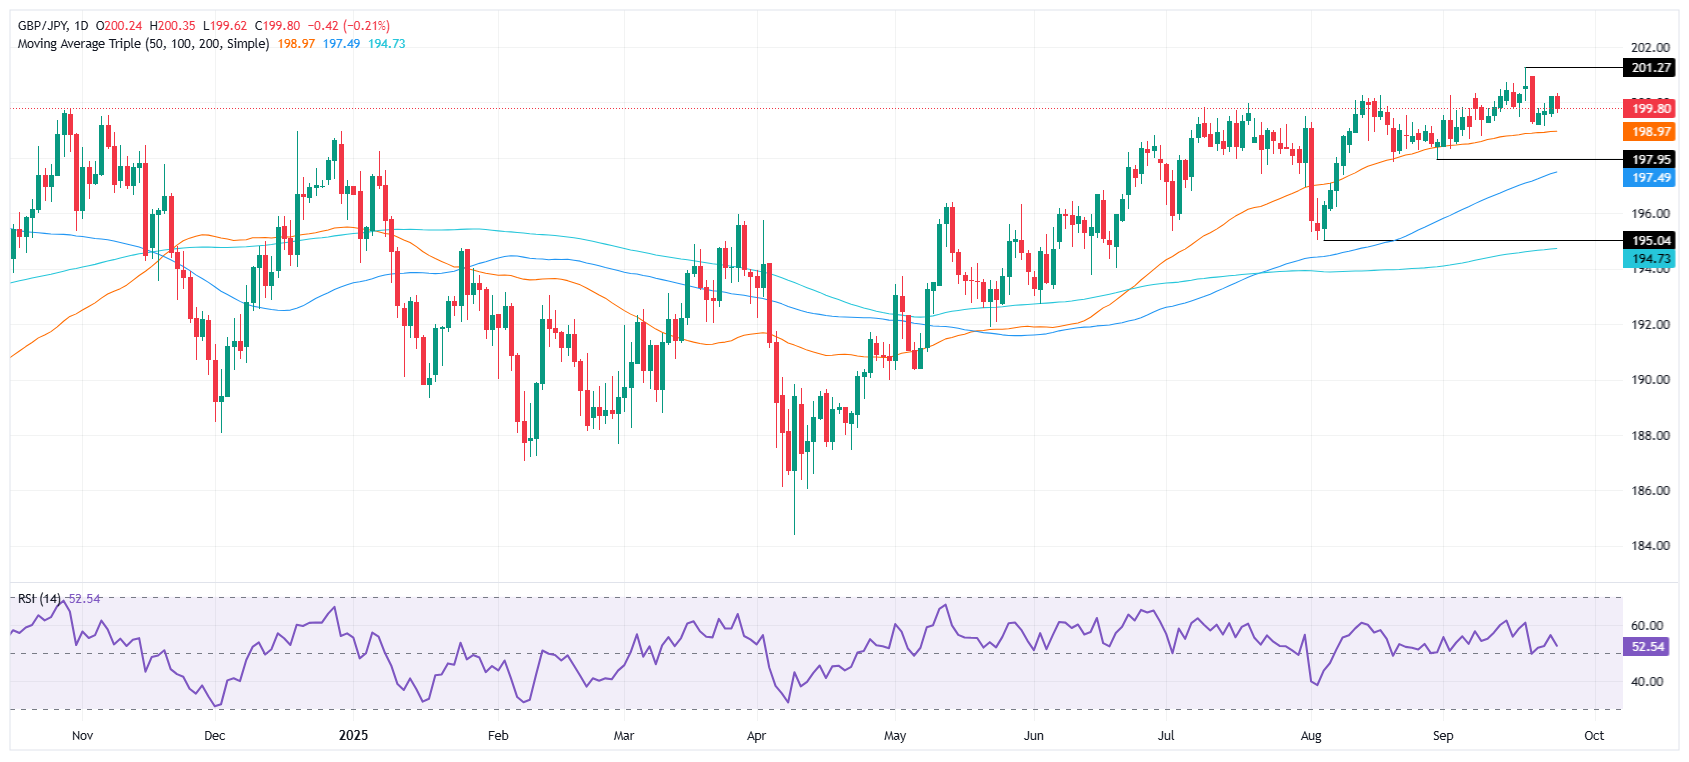
GBP/JPY Price Forecast: Technical outlook
Despite being poised to test higher prices, the GBP/JPY is forming a ‘dark cloud cover’ a bearish candle chart pattern that indicates that sellers outweighed buyers. Nevertheless it needs confirmation below the September 24 low of 199.46, which could clear the path to test the 199.00 figure. In that outcome, the next support would be the 50-day SMA at198.96, ahead of testing the August 29 low of 197.94.
On the flipside, if bulls regain 200.00 the next areas of interest would be 200.50 and the 201.00 figure.
Pound Sterling Price This week
The table below shows the percentage change of British Pound (GBP) against listed major currencies this week. British Pound was the strongest against the New Zealand Dollar.
| USD | EUR | GBP | JPY | CAD | AUD | NZD | CHF | |
|---|---|---|---|---|---|---|---|---|
| USD | 0.61% | 0.93% | 1.20% | 1.05% | 0.81% | 1.65% | 0.76% | |
| EUR | -0.61% | 0.33% | 0.58% | 0.41% | 0.14% | 0.99% | 0.12% | |
| GBP | -0.93% | -0.33% | 0.18% | 0.11% | -0.16% | 0.69% | -0.16% | |
| JPY | -1.20% | -0.58% | -0.18% | -0.18% | -0.43% | 0.42% | -0.44% | |
| CAD | -1.05% | -0.41% | -0.11% | 0.18% | -0.25% | 0.59% | -0.26% | |
| AUD | -0.81% | -0.14% | 0.16% | 0.43% | 0.25% | 0.86% | -0.01% | |
| NZD | -1.65% | -0.99% | -0.69% | -0.42% | -0.59% | -0.86% | -0.88% | |
| CHF | -0.76% | -0.12% | 0.16% | 0.44% | 0.26% | 0.01% | 0.88% |
The heat map shows percentage changes of major currencies against each other. The base currency is picked from the left column, while the quote currency is picked from the top row. For example, if you pick the British Pound from the left column and move along the horizontal line to the US Dollar, the percentage change displayed in the box will represent GBP (base)/USD (quote).
Recommended Articles


