

US Dollar Index Price Forecast: DXY eases from two-week high, dips to 97.75/38.2% Fibo.

- WTI Oil pulls back as Hormuz supply worries ease, Iran-US tensions keep volatility high
- Trump says US to help ships stranded in Strait of Hormuz as tanker hit by projectiles
- Bitcoin Price Forecast: BTC hits three-month high on derivatives-led surge
- Australian Dollar holds losses ahead of RBA policy decision
- Ignoring Strategy Reduction Warning, Bitcoin Nears $82,000, Hitting Highest Price Since February
- Crypto Overview: Toncoin, Terra Classic rise by double digits as Bitcoin grips $80,000

The USD struggles to capitalize on the previous day's strong move up to a two-week high.
Fed Chair Powell's cautious remarks on rate cuts could act as a tailwind for the Greenback.
The technical setup favors the USD bulls and backs the case for the emergence of dip-buying.
The US Dollar Index (DXY), which tracks the Greenback against a basket of currencies, edges lower during the Asian session on Thursday and erodes a part of the previous day's strong move up to the 98.00 neighborhood, or a two-week high. The index is currently placed around the 97.75 region, down 0.10% for the day, though the lack of follow-through selling warrants caution for bearish traders.
The growing acceptance that the US Federal Reserve (Fed) will lower borrowing costs again in October and December, following a 25 basis points rate cut earlier this month, turns out to be a key factor acting as a headwind for the USD. However, Fed Chair Jerome Powell's cautious remarks on potential interest rate cuts hold back the USD bears from placing aggressive bets and should help limit deeper losses.
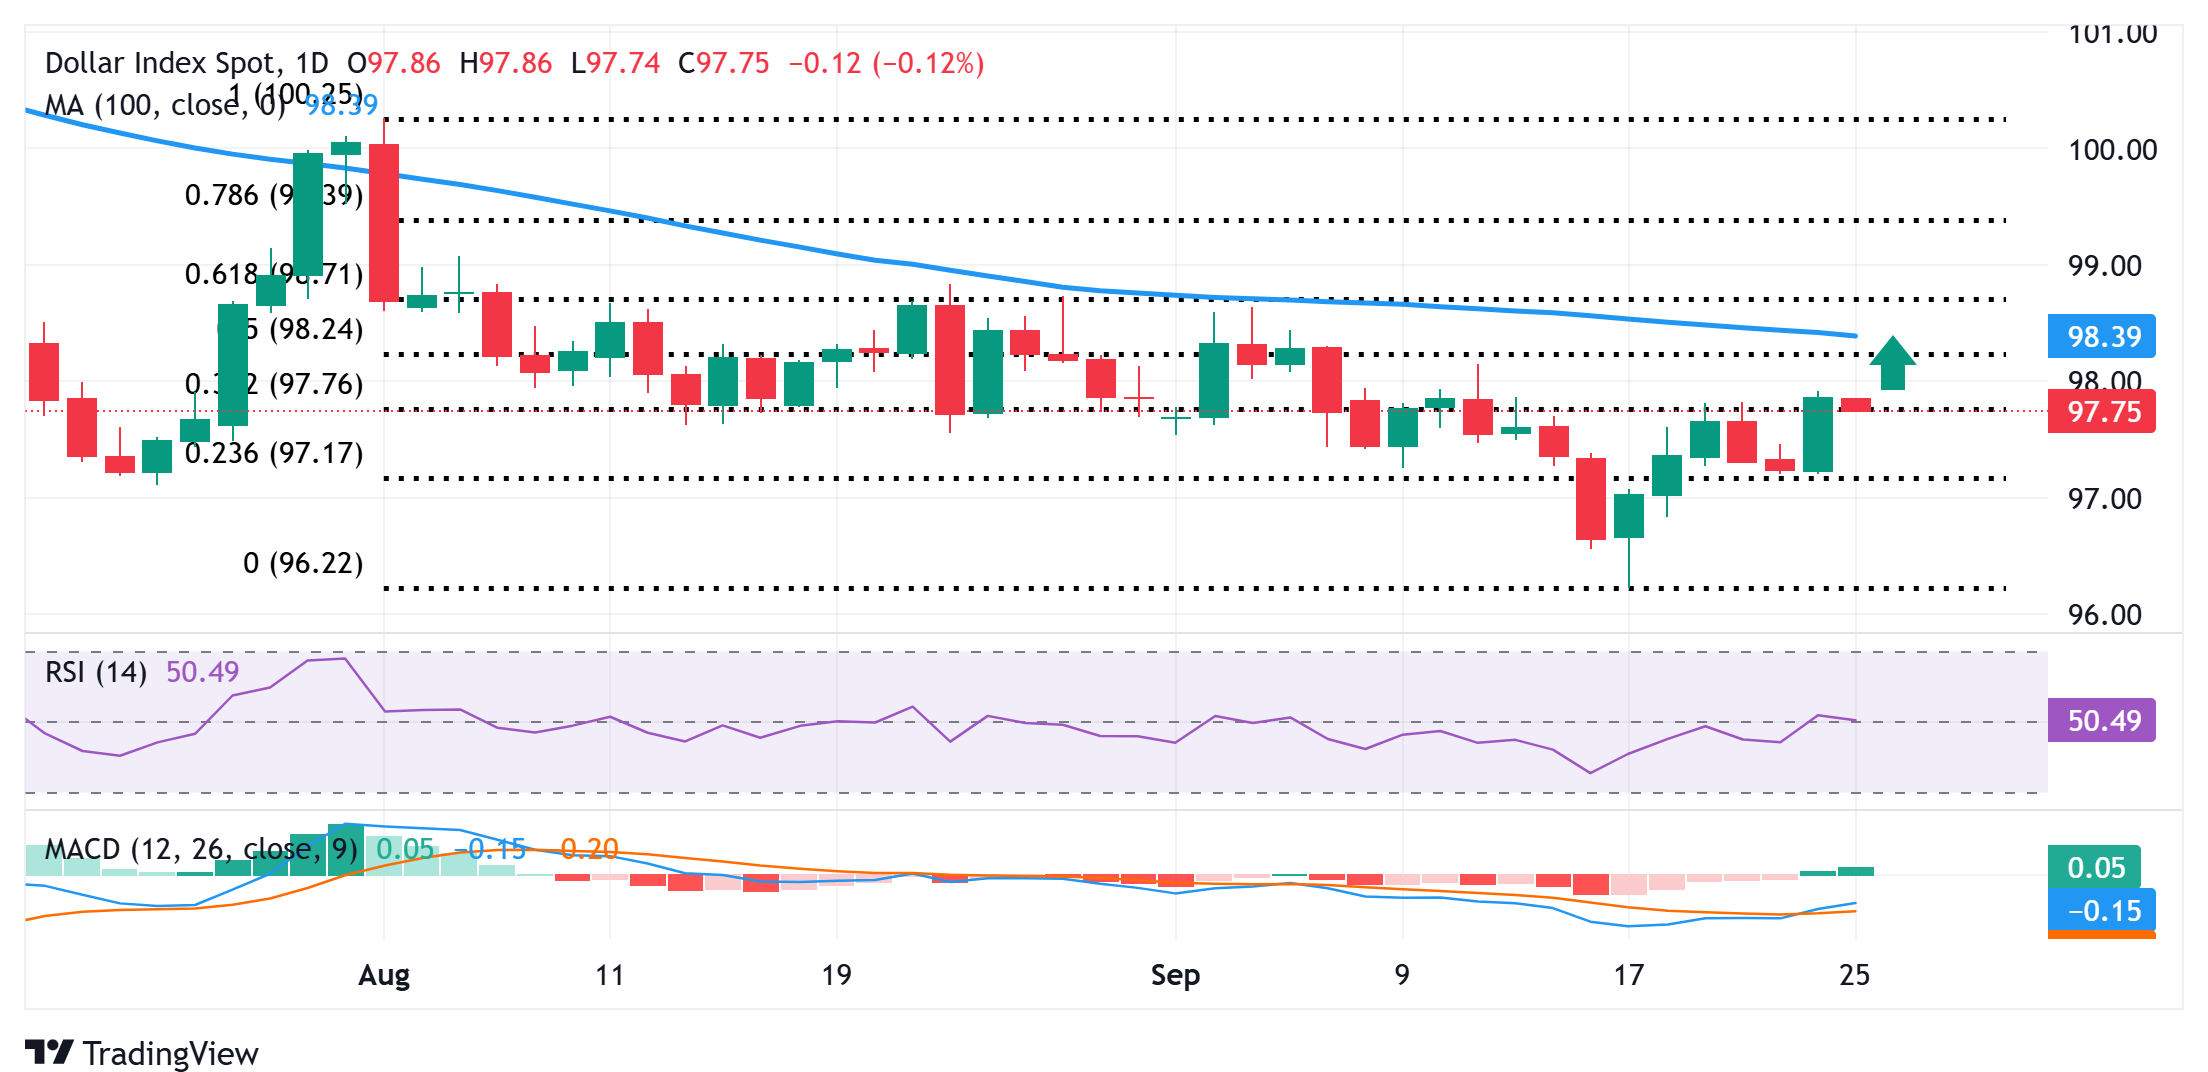
From a technical perspective, the overnight close above the 38.2% Fibonacci retracement level of the August-September downfall could be seen as a key trigger for the USD bulls. Moreover, oscillators on the daily chart have just started moving into positive territory and back the case for the emergence of dip-buying near the 97.50 area, which is followed by the 97.25 region, or the 23.6% Fibo. retracement level.
A convincing break below the latter might prompt some technical selling and make the DXY vulnerable to weaken further below the 97.00 round figure, towards the next relevant support near the 96.65 region. The downward trajectory could extend further towards the 96.25-96.20 area, or the lowest level since July 2022, touched in reaction to the US central bank's first rate cut since December last Wednesday.
On the flip side, bulls might now wait for a move beyond the 98.00 mark before positioning for any further gains towards the 98.25 zone, or the 50% Fibo. retracement level, en route to the 100-day Simple Moving Average (SMA), near the 96.40 region. This is followed by the 61.8% Fibo. retracement level, around the 96.70 area, which, if cleared, will suggest that the USD Index has bottomed out and set the stage for further gains.
US Dollar Index daily chart
Read more
* The content presented above, whether from a third party or not, is considered as general advice only. This article should not be construed as containing investment advice, investment recommendations, an offer of or solicitation for any transactions in financial instruments.


