NZD/USD Price Analysis: Finds temporary support slightly below 0.6000, downside remains favored

Source Fxstreet
  • NZD/USD is expected to see more downside due to multiple headwinds.
  • Investors remain uncertain ahead of the US core PCE inflation for February.
  • A breakdown of the Double Top formation weakens the Kiwi asset.

The NZD/USD pair finds interim support near 0.5990 in the European session on Wednesday. The Kiwi asset is vulnerable in the broader term as the New Zealand economy has shifted into a technical recession. The economy was contracted in the last two quarters of 2023.

The Reserve Bank of New Zealand (RBNZ) is facing a balancing act between high inflation and a poor economic outlook. To maintain downward pressure on stubborn inflation, the RBNZ maintains the Official Cash Rate (OCR) at 5.5%. However, economic activities bear the consequences. Low liquidity flow in an economy dampens firms’ investment plans and consumer spending.

Meanwhile, asset-specific action is being observed in global markets as risk-perceived currencies face the heat of uncertainty ahead of the United States core Personal Consumption Expenditure price index (PCE) data for February, which will be published on Good Friday. S&P 500 futures have posted significant gains in the London session.

The US Dollar Index (DXY) rises to 104.40, an inch away from monthly high of 104.50. 10-year US Treasury yields remain unchanged at 4.23%.

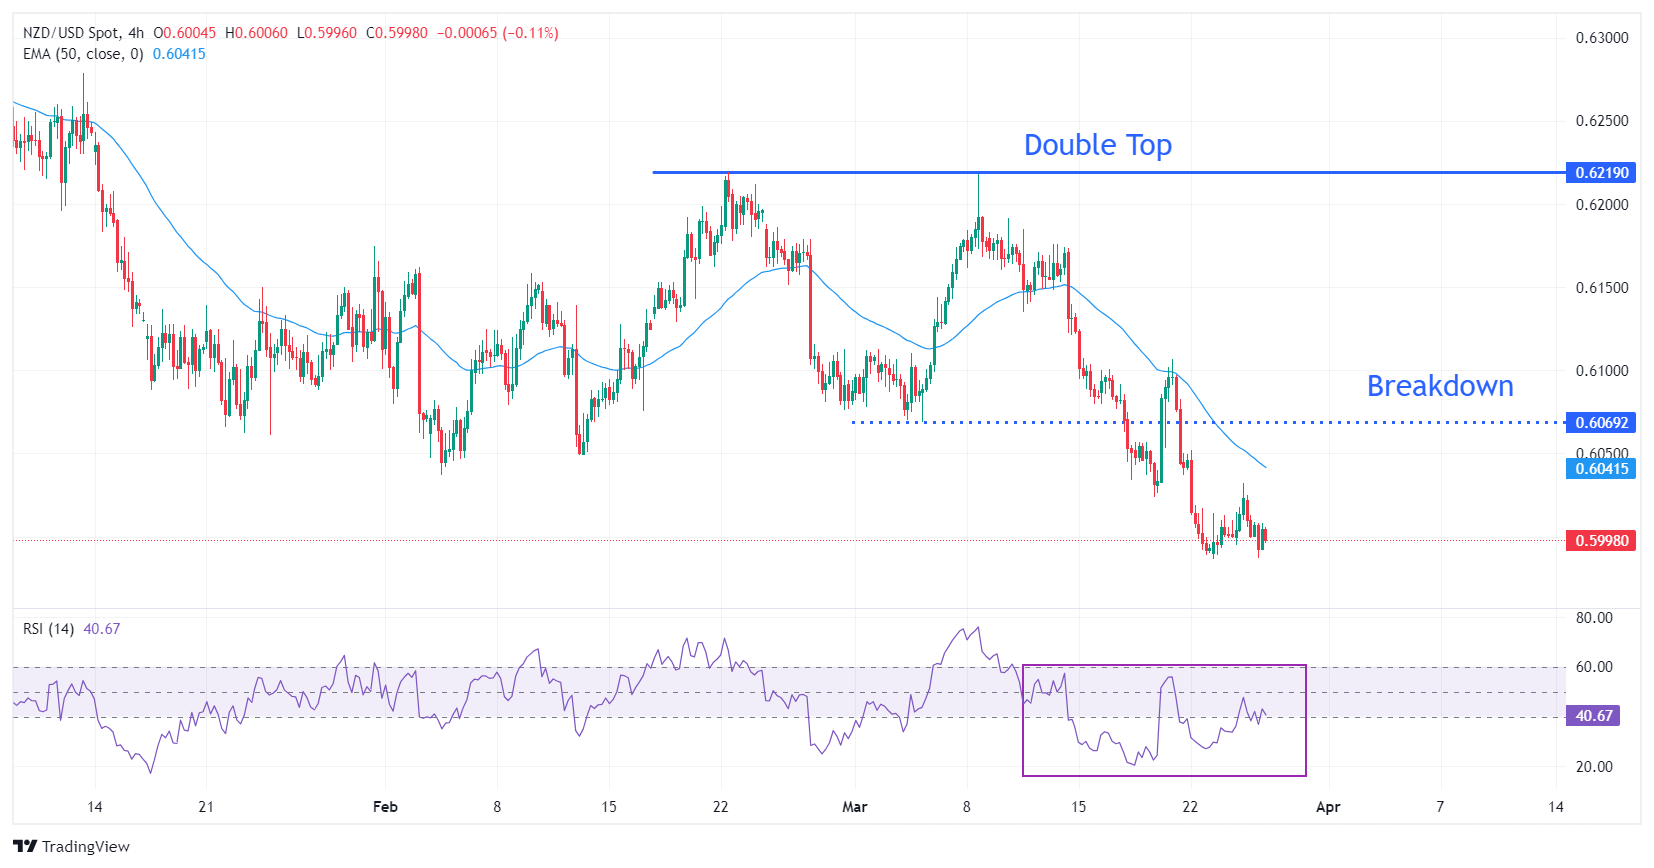
NZD/USD sees a sharp downside move after a breakdown of the Double Top chart formation near 0.6069 on a four-hour timeframe. The asset has tested territory below the psychological support of 0.6000 and is expected to discover more downside. The 50-period Exponential Moving Average (EMA) near 0.6040 is a major barricade for the New Zealand Dollar bulls.

The 14-period Relative Strength Index (RSI) oscillates in the bearish range of 20.00-60.000. Investors would look for building fresh shorts whenever the RSI witnessed a pullback to 60.00.

If the asset breaks below the intraday low of 0.5987, more downside will appear. This would drag the asset toward the November 17 low at 0.5940, followed by the round-level support of 0.5900.

In an alternate scenario, a recovery move above March 6 low at 0.6069 will drive the pair toward March 18 high at 0.6100. A breach of the latter will drive the asset further to March 12 low at 0.6135.

NZD/USD four-hour chart
NZD/USD

Overview
Today last price 0.6004
Today Daily Change 0.0000
Today Daily Change % 0.00
Today daily open 0.6004
 
Trends
Daily SMA20 0.6096
Daily SMA50 0.6111
Daily SMA100 0.6135
Daily SMA200 0.6075
 
Levels
Previous Daily High 0.6032
Previous Daily Low 0.5995
Previous Weekly High 0.6107
Previous Weekly Low 0.5989
Previous Monthly High 0.6219
Previous Monthly Low 0.6037
Daily Fibonacci 38.2% 0.6018
Daily Fibonacci 61.8% 0.6009
Daily Pivot Point S1 0.5989
Daily Pivot Point S2 0.5973
Daily Pivot Point S3 0.5952
Daily Pivot Point R1 0.6026
Daily Pivot Point R2 0.6047
Daily Pivot Point R3 0.6063


Disclaimer: For information purposes only. Past performance is not indicative of future results.
placeholder
Ethereum Edges Toward Long-Term Holders’ Cost Basis, Now Only 8% Above Key Accumulation LevelEthereum is trading near $3,150 and just 8% above a key $2,895 long-term holders’ cost basis, with on-chain flows, macro uncertainty and support around $3,000–$2,800 all shaping what comes next for ETH.
Author  Mitrade
Nov 18, Tue
Ethereum is trading near $3,150 and just 8% above a key $2,895 long-term holders’ cost basis, with on-chain flows, macro uncertainty and support around $3,000–$2,800 all shaping what comes next for ETH.
placeholder
Top 3 Price Prediction: Bitcoin, Ethereum, Ripple – BTC, ETH and XRP Look for a Foothold After a Sharp ShakeoutBitcoin trades near $92,600 after a dip below $90,000, while Ethereum around $3,118 and XRP near $2.21–$2.23 sit on key support zones, as BTC, ETH and XRP all try to turn a sharp correction into a tradable rebound rather than a deeper slide.
Author  Mitrade
Nov 19, Wed
Bitcoin trades near $92,600 after a dip below $90,000, while Ethereum around $3,118 and XRP near $2.21–$2.23 sit on key support zones, as BTC, ETH and XRP all try to turn a sharp correction into a tradable rebound rather than a deeper slide.
placeholder
Could XRP Really Catch Ethereum? Analysts Revisit the Question as ETF Tailwinds BuildAs US spot XRP ETFs roll out and issuers like Canary Capital and Franklin Templeton step in, analysts say XRP’s market cap could climb on growing utility and ETF accumulation—but overtaking Ethereum’s $373 billion smart-contract powerhouse remains a long-shot, at least for now.
Author  Mitrade
Nov 20, Thu
As US spot XRP ETFs roll out and issuers like Canary Capital and Franklin Templeton step in, analysts say XRP’s market cap could climb on growing utility and ETF accumulation—but overtaking Ethereum’s $373 billion smart-contract powerhouse remains a long-shot, at least for now.
placeholder
Market Meltdown: BTC, ETH, and XRP Capitulate as Bears Seize ControlBitcoin trades around $85,900 after breaking below $86,000, with Ethereum under $2,791 and XRP below $1.99 as BTC, ETH and XRP extend weekly losses of 8–10%, forcing traders to focus on supports at $85,000, $2,749 and $1.77 for clues on whether this sell-off has further to run.
Author  Mitrade
Nov 21, Fri
Bitcoin trades around $85,900 after breaking below $86,000, with Ethereum under $2,791 and XRP below $1.99 as BTC, ETH and XRP extend weekly losses of 8–10%, forcing traders to focus on supports at $85,000, $2,749 and $1.77 for clues on whether this sell-off has further to run.
placeholder
Bitcoin Volatility Spikes: Is Options-Driven Pricing Making a Comeback?Bitcoin's volatility is surging, suggesting a shift back to options-driven price action seen before Bitcoin ETFs were launched.
Author  Mitrade
2 hours ago
Bitcoin's volatility is surging, suggesting a shift back to options-driven price action seen before Bitcoin ETFs were launched.
goTop
quote