
USD/CAD Price Forecast: Testing key resistance at the 1.3880 area
- The US Dollar remains bid against the Loonie on Thursday, with bulls pushing against the 1.3880 resistance area.
- Investors' fears of a hawkish Powell keep the US Dollar pinned near highs.
- USD/CAD: Above 1.3880, the next bullish target is 1.3920
The US Dollar trades higher for the fourth consecutive day against its Canadian Counterpart on Thursday, with bulls pushing against three-month highs at the 1.3880 area, ahead of US preliminary PMI figures due later on Thursday and, more importantly, Fed Chair Powell’s speech on Friday.
Business activity is expected to have slowed down somewhat in both the manufacturing and the services sectors in August, although the impact on the US Dollar is likely to be limited.
Investors will be looking at Powell’s speech at the Jackson Hole summit for clues about the bank’s monetary policy plans. With the market pricing an 80% chance of a Fed cut in September, there is a relevant risk that a not-dovish-enough Powell spoils the party and sends the US Dollar higher across the board.
Technical Analysis: Beyond 1.1880, the next target is 1.3920
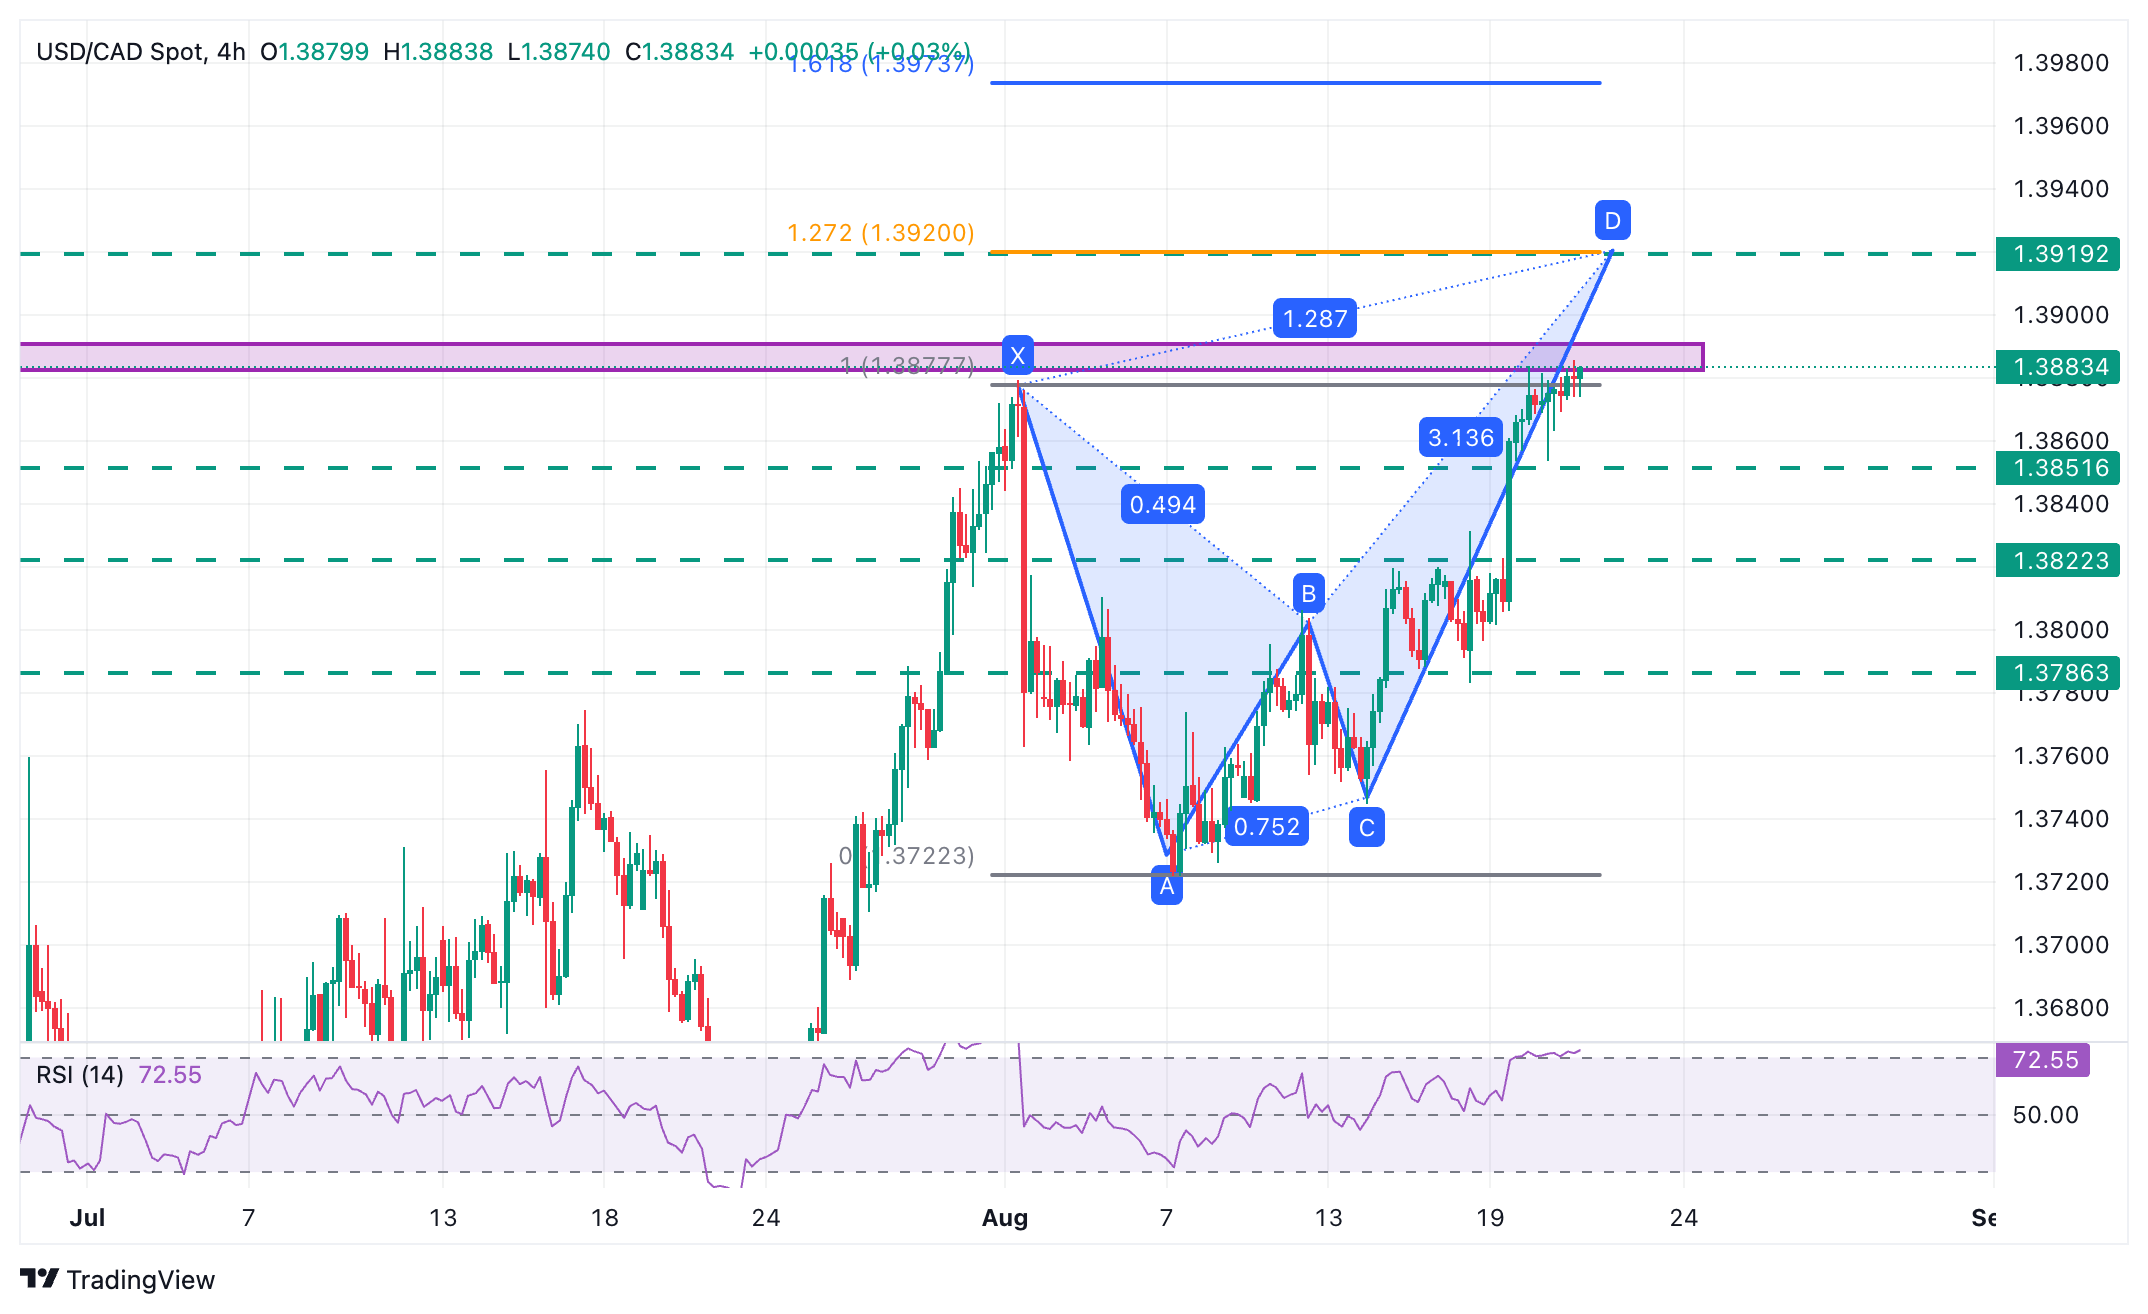
The technical picture is bullish, with downside attempts limited. The 4-Hour RSI is still at oversold levels, which suggests that a further correction is on the cards. Still, Wednesday’s lows, at 1.3955, are likely to challenge bears.
Bulls are now capped at the confidence of the May 22 and August highs between 0.8880 and 0.8890. A confirmation above here would lure bulls into the May 16 lows, at 0.8920, which is the 127.2% Fibonacci extension and a plausible target for a harmonic Butterfly Pattern.
A bearish rejection from the current resistance, pushing price action beyond Wednesday´s low of 1.3955, on the contrary, would clear the path to the 1.3820-1.3830 (August 14,15, and 18 highs). Further down, the August 15 and 18 lows, at 1.3785, are next.
US Dollar Price Today
The table below shows the percentage change of US Dollar (USD) against listed major currencies today. US Dollar was the strongest against the Japanese Yen.
| USD | EUR | GBP | JPY | CAD | AUD | NZD | CHF | |
|---|---|---|---|---|---|---|---|---|
| USD | 0.02% | -0.12% | 0.35% | 0.05% | 0.03% | -0.13% | 0.24% | |
| EUR | -0.02% | -0.16% | 0.33% | 0.02% | 0.08% | -0.11% | 0.21% | |
| GBP | 0.12% | 0.16% | 0.48% | 0.19% | 0.25% | 0.06% | 0.38% | |
| JPY | -0.35% | -0.33% | -0.48% | -0.29% | -0.31% | -0.45% | -0.07% | |
| CAD | -0.05% | -0.02% | -0.19% | 0.29% | -0.05% | -0.20% | 0.19% | |
| AUD | -0.03% | -0.08% | -0.25% | 0.31% | 0.05% | -0.10% | 0.21% | |
| NZD | 0.13% | 0.11% | -0.06% | 0.45% | 0.20% | 0.10% | 0.32% | |
| CHF | -0.24% | -0.21% | -0.38% | 0.07% | -0.19% | -0.21% | -0.32% |
The heat map shows percentage changes of major currencies against each other. The base currency is picked from the left column, while the quote currency is picked from the top row. For example, if you pick the US Dollar from the left column and move along the horizontal line to the Japanese Yen, the percentage change displayed in the box will represent USD (base)/JPY (quote).
Recommended Articles


