


USD/JPY Price Forecast: Consolidates but falls below 50-day SMA
- USD/JPY logs back-to-back declines; traders wary as political pressure targets Fed governance.
- Price boxed between 20- and 50-day SMAs; Jackson Hole speech is next catalyst.
- Hawkish outcome to push USD/JPY above 148.00; otherwise, a drop below 147.00 looms.
USD/JPY prints back-to-back bearish days during the week, down 0.17% on Wednesday as the Greenback sold off on fears that the Trump administration threatens the Federal Reserve’s independence. At the time of writing, the pair trades at 147.37 after hitting a daily high of 147.81.
Bloomberg revealed that the Federal Housing Finance Agency Director Bill Pulte urged US Attorney General Pam Bondi to investigate Cook over a pair of mortgages. Pulte alleges that Cook “falsified bank documents and property records to acquire more favorable loan terms, potentially committing mortgage fraud under the criminal statute.”
In the meantime, the latest Fed meeting minutes maintained the status quo, as Fed officials remain focused on inflation, and that neutral rates are not far below the current level.
USD/JPY Price Forecast: Technical outlook
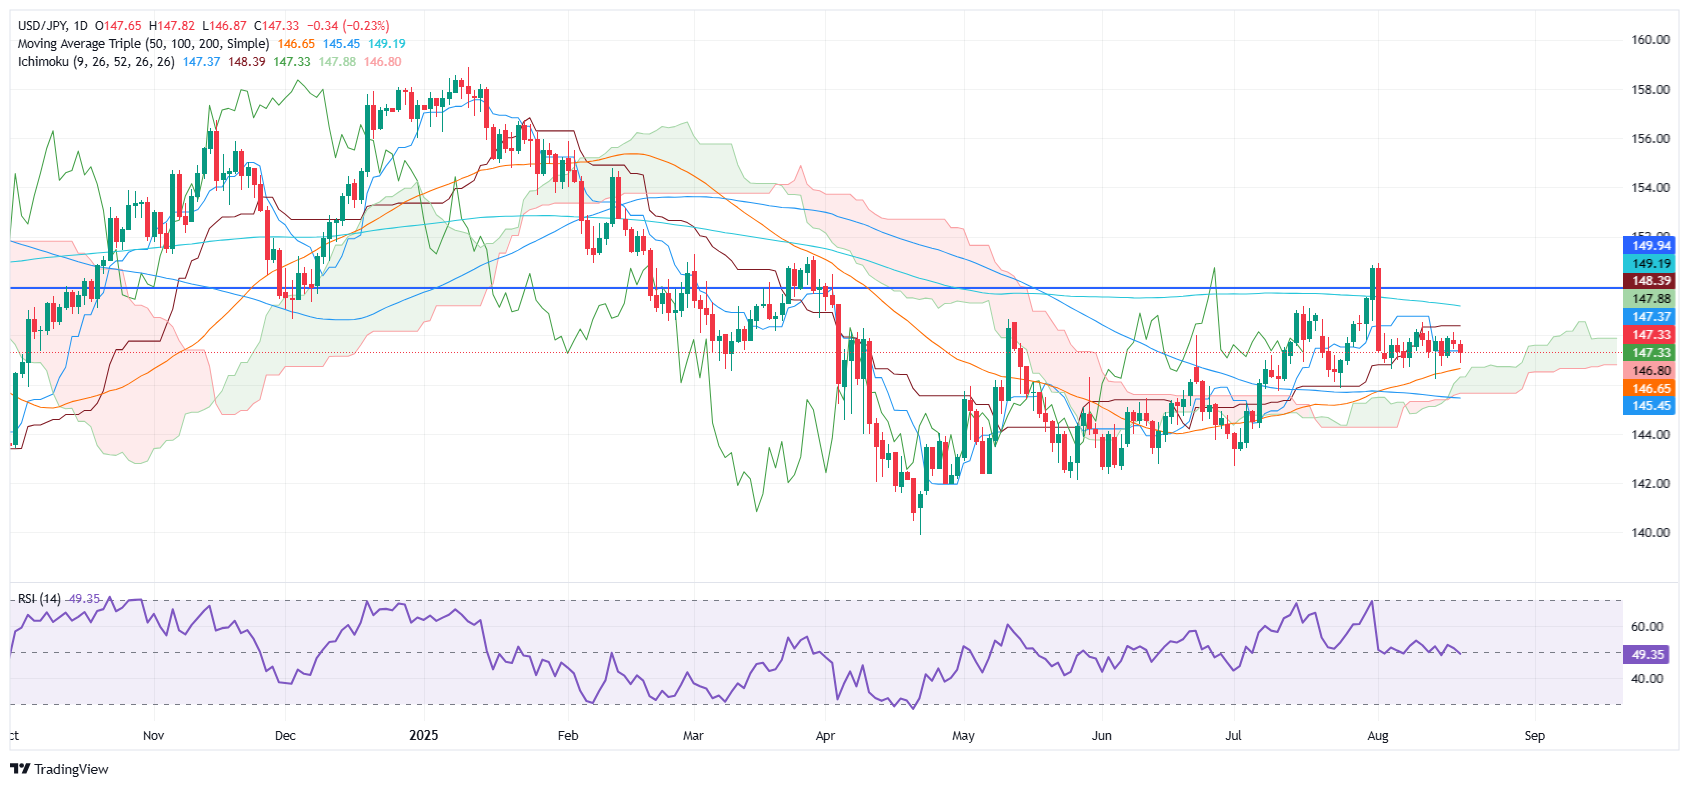
USD/JPY is set to consolidate within the 20 and 50-day Simple Moving Averages (SMAs), each at 147.86 and 146.70, respectively. Momentum suggests that neither buyers nor sellers are committing to open fresh positions, as they await the outcome of Fed Chair Jerome Powell's speech at Jackson Hole.
If USD/JPY climbs above the 20-day SMA at 147.86, expect a test of 148.00. A breach of the latter will expose August 12’s peak at 148.51, followed by the 200-day SMA at 149.15. On the flip side, if the pair tumbles below 147.00, the first support would be the 50-day SMA at 146.70. Once surpassed, the next stop would be 146.00 and the 100-day SMA at 145.44.
USD/JPY Price Chart – Daily
Japanese Yen PRICE This week
The table below shows the percentage change of Japanese Yen (JPY) against listed major currencies this week. Japanese Yen was the strongest against the New Zealand Dollar.
| USD | EUR | GBP | JPY | CAD | AUD | NZD | CHF | |
|---|---|---|---|---|---|---|---|---|
| USD | 0.51% | 0.74% | 0.12% | 0.41% | 1.23% | 1.77% | -0.22% | |
| EUR | -0.51% | 0.19% | -0.41% | -0.10% | 0.73% | 1.21% | -0.71% | |
| GBP | -0.74% | -0.19% | -0.65% | -0.30% | 0.59% | 1.07% | -0.96% | |
| JPY | -0.12% | 0.41% | 0.65% | 0.32% | 1.13% | 1.68% | -0.33% | |
| CAD | -0.41% | 0.10% | 0.30% | -0.32% | 0.77% | 1.38% | -0.66% | |
| AUD | -1.23% | -0.73% | -0.59% | -1.13% | -0.77% | 0.51% | -1.48% | |
| NZD | -1.77% | -1.21% | -1.07% | -1.68% | -1.38% | -0.51% | -2.01% | |
| CHF | 0.22% | 0.71% | 0.96% | 0.33% | 0.66% | 1.48% | 2.01% |
The heat map shows percentage changes of major currencies against each other. The base currency is picked from the left column, while the quote currency is picked from the top row. For example, if you pick the Japanese Yen from the left column and move along the horizontal line to the US Dollar, the percentage change displayed in the box will represent JPY (base)/USD (quote).
Recommended Articles


