


Vertiv Holdings Co Stock (VRT) Moved Up by 4.91% on Sep 8: What Signal Does It Send?
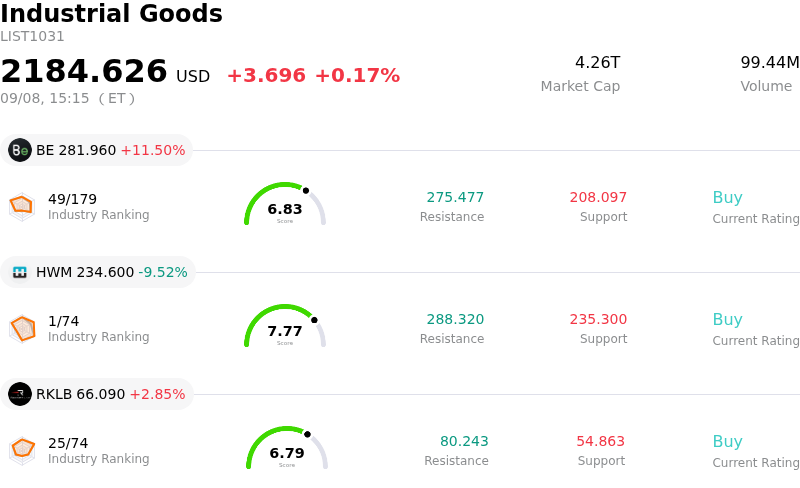
Vertiv Holdings Co (VRT) moved up by 4.91%. The Industrial Goods sector is up by 0.17%. The company outperformed the industry. Top 3 stocks by turnover in the sector: Bloom Energy Corp (BE) up 11.50%; Howmet Aerospace Inc (HWM) down 9.52%; Rocket Lab USA Inc (RKLB) up 2.85%.
What is driving Vertiv Holdings Co (VRT)’s stock price up today?
Vertiv Holdings advanced significantly during trading, recovering strongly from recent volatility as investor sentiment rallied around the company's recent strategic moves and solid underlying fundamentals. The primary catalyst driving the upward movement stems from Vertiv's announced agreement to acquire UtilityInnovation Group. This transaction strategically extends Vertiv's portfolio upstream into microgrid controls, on-site generation, and behind-the-meter power architecture. By addressing the critical industry bottleneck of time-to-power for high-demand artificial intelligence data centers, the acquisition reinforces Vertiv's leadership position across the AI digital infrastructure ecosystem.
Beyond merger and acquisition momentum, market participants are increasingly refocusing on Vertiv's robust financial trajectory and expanding backlog. The company previously delivered impressive second-quarter operational growth, characterized by strong year-over-year gains in adjusted earnings per share and substantial organic revenue expansion. Management's upward revision of full-year sales, operating profit, and cash flow guidance has reassured investors that demand for liquid cooling, thermal management, and uninterruptible power systems remains exceptionally strong among cloud hyperscalers and enterprise customers.
Favorable institutional positioning and positive analyst commentary also contributed to the upward price trajectory. Research reports highlighted Vertiv's attractive growth-adjusted valuation following previous pullbacks, noting that upward revisions in consensus earnings estimates underscore sustainable momentum. Despite broader market intraday volatility, persistent demand for AI infrastructure enablers continues to provide solid tailwinds for the stock as institutional capital flows toward critical digital infrastructure providers.
Technical Analysis of Vertiv Holdings Co (VRT)
Technically, Vertiv Holdings Co (VRT) shows a MACD (12,26,9) value of 7.202, indicating a neutral signal. The RSI at 60.502 suggests neutral condition and the Williams %R at 1.740 suggests overbought condition. Please monitor closely.
Media Coverage of Vertiv Holdings Co (VRT)
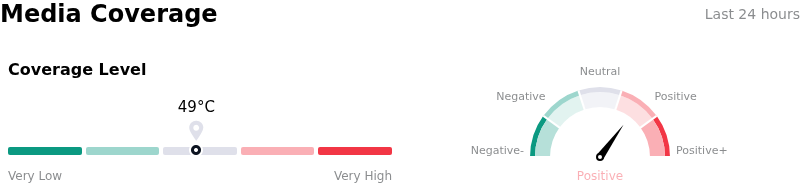
In terms of media coverage, Vertiv Holdings Co (VRT) shows a coverage score of 49, indicating a moderate level of media attention. The overall market sentiment index is currently in bullish zone.
Fundamental Analysis of Vertiv Holdings Co (VRT)
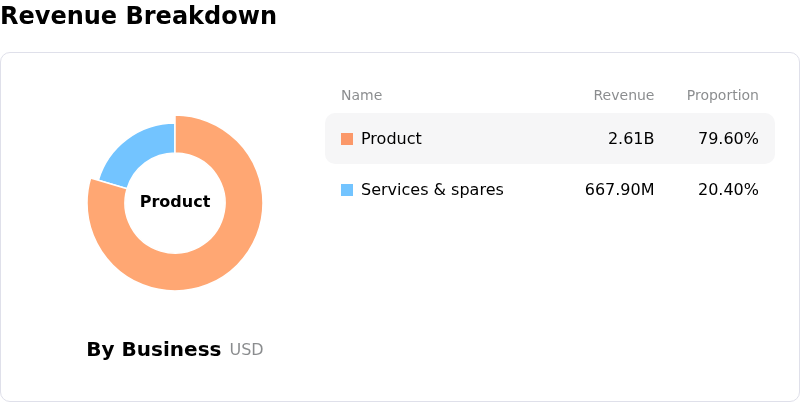
Vertiv Holdings Co (VRT) is in the Industrial Goods industry. Its latest annual revenue is $10.23B, ranking 17 in the industry. The net profit is $1.33B, ranking 13 in the industry. Company Profile
Over the past month, multiple analysts have rated the company as Buy, with an average price target of $331.02, a high of $400.00, and a low of $188.00.
More details about Vertiv Holdings Co (VRT)
Company Specific Risks:
- Converged System Execution Complexity: Management highlighted operational and coordination complexities in delivering large-scale converged AI data center systems, acknowledging revenue recognition timing variability depending on component convergence at integration facilities.
- Pending Acquisition and Regulatory Approval Risk: The pending $1.45 billion acquisition of Utility Innovation Group (UIG) remains subject to regulatory approvals through Q4 2026, creating operational integration hurdles and capital deployment risks if closing timelines or synergies stall.
- Significant Insider Share Liquidation: Recent SEC disclosures showed Director Edward Monser executed a $3.88 million stock sale under a Rule 10b5-1 plan, reducing his direct equity holding by approximately 48% and dampening short-term institutional sentiment.
- Premium Valuation Volatility Exposure: Trading at an elevated earnings multiple above 60x, the company remains highly vulnerable to sharp intraday downside volatility if hyperscaler project schedules face minor delivery or revenue timing shifts.
Recommended Articles


