


BNB (BNBUSD) Suddenly Goes up 1.35% on Sep 8: What You Need to Watch
BNB (BNBUSD) is up 1.35% at Sep 8 01:20(ET), now at $748.2, with a 7-day up of 10.19%.
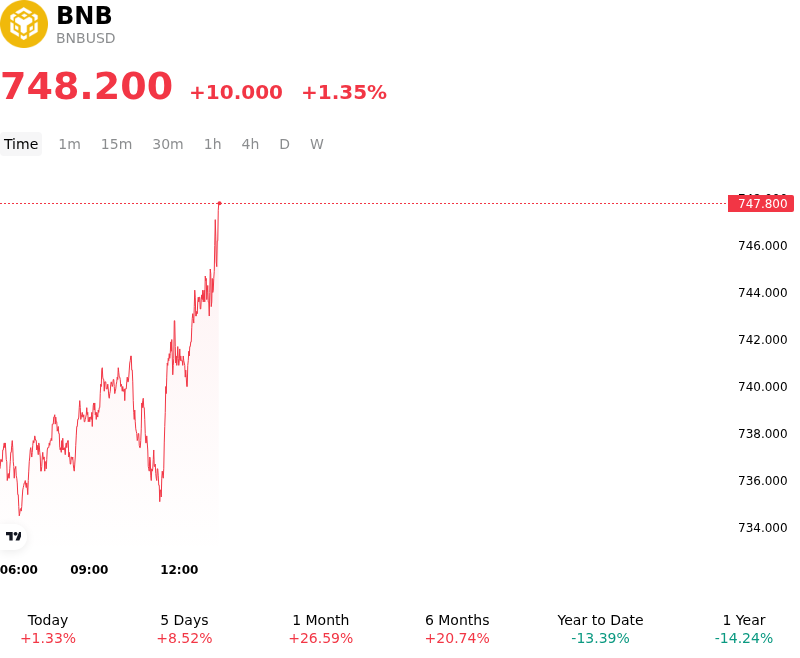
What is driving BNB (BNBUSD)’s stock price up today?
Capital inflows into BNB have been driven primarily by expanding network utility on the BNB Smart Chain and positive momentum surrounding recent ecosystem upgrades. Investor sentiment strengthened following technical roadmaps and new product rollouts, notably the integration of AI-agent infrastructure, decentralized wallet tools, and expanded real-world asset settlement capabilities. The launch of early-access initiatives for native AI features within the broader exchange ecosystem enhanced long-term adoption expectations, re-engaging institutional and retail interest in BNB as both an exchange utility asset and the native token powering a high-throughput Layer-1 network.
On-chain metrics and liquidity conditions provided additional support for the upward price movement. Improved throughput and reduced transaction finality across the BNB Smart Chain have sustained elevated daily active user figures and robust transaction volumes, reinforcing fundamental demand for the token. In derivatives markets, a clearing of short positioning above recent consolidation bands triggered liquidity-driven buying, enabling the price to decisively breach technical supply zones that had constrained previous recovery attempts. Concurrently, promotional initiatives for stablecoin transfers and bridging on the network stimulated decentralized finance activity, further boosting on-chain capital velocity.
From a macro and structural perspective, the asset's performance reflects broader capital reallocation toward established top-tier digital assets with clear tokenomic burn mechanics and active ecosystem usage. While broader financial market sentiment and macroeconomic conditions continue to dictate overall risk appetite, BNB demonstrated resilient idiosyncratic demand underpinned by exchange trading activity and protocol-level gas consumption. Institutional investors continue to monitor key technical resistance levels, ecosystem transaction volume, and global regulatory developments to evaluate whether this upward traction represents a sustained structural expansion or an intraday liquidity repricing.
Technical Analysis of BNB (BNBUSD)
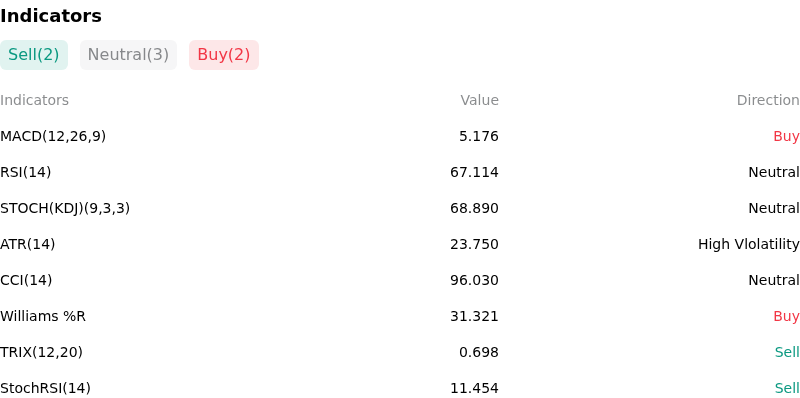
Technically, BNB (BNBUSD) shows a MACD (12,26,9) value of 5.176, indicating a buy signal. The RSI at 67.114 suggests neutral condition and the Williams %R at 31.321 suggests buy condition. Please monitor closely.
More details about BNB (BNBUSD)
Recent Events and Risks:
- Regulatory and Regional Legal Scrutiny: Heightened regulatory friction across European jurisdictions and legal challenges surrounding derivative product offerings create continuous headline risk and compliance headwinds for the Binance ecosystem and BNB.
- DeFi Leverage Looping and Liquidation Exposure: High-leverage borrowing activity on Venus Protocol—where large holders deposit BNB as collateral to borrow stablecoins—creates systemic risk of cascading forced liquidations if market price breaks through key intraday support zones.
- Declining On-Chain Activity and Liquidity Depth: A noticeable contraction in daily transaction volume on the BNB Chain points to reduced network usage and thinning spot market absorption, increasing price sensitivity to sudden sell orders.
- Derivatives Overleveraging and Profit-Taking: Technical rejections at overhead resistance levels have triggered automated long position liquidations across perpetual swap venues, forcing leverage unwinding and suppressing immediate buy-side liquidity.
Recommended Articles


