


Natural Gas (NATGAS) Moved Sharply on Sep 7: Inventories, the Dollar, or Geopolitics?
Natural Gas (NATGAS) is up 2.16% at Sep 7 07:10(ET), now at $3.033, with a 7-day up of 3.23%.
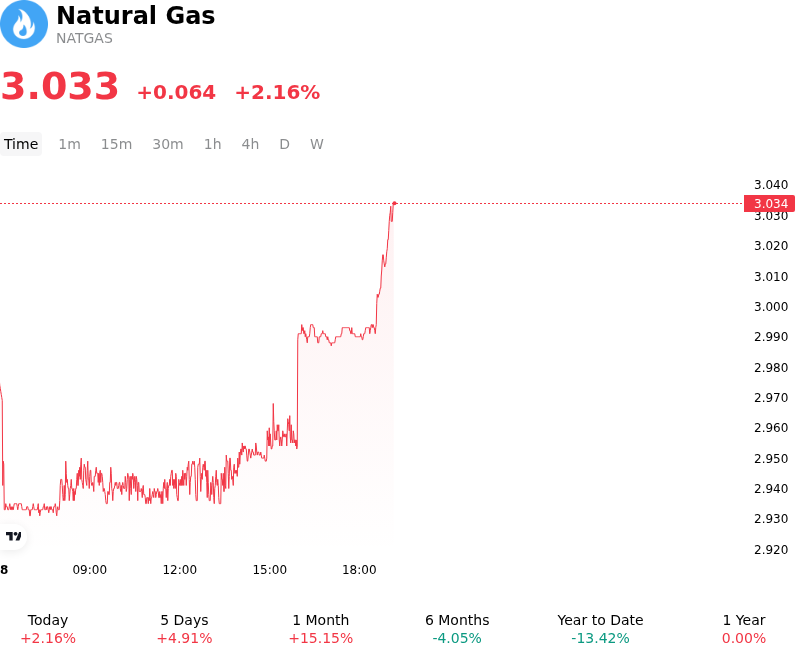
What is driving Natural Gas (NATGAS)’s stock price up today?
Natural gas futures advanced as updated mid-September weather models projected above-average temperatures across major population centers in the central, western, and southern United States. The extended warm forecast raised expectations for prolonged late-summer cooling demand, prompting electric utilities to maintain elevated natural gas burn for power generation. This shift toward warmer weather patterns reversed expectations of an immediate seasonal cooldown, tightening near-term supply-demand balances and encouraging prompt-month buying.
Supporting the upward trajectory was a continued rebound in liquefied natural gas feedgas intake across Gulf Coast export facilities, driven by firm European and Asian demand heading into the Northern Hemisphere winter. With international gas prices trading at a significant premium to Henry Hub benchmarks, export capacity utilization remained strong. Simultaneously, market participants digested recent storage reports indicating below-average weekly injection figures, which contributed to a gradual erosion of the storage surplus relative to five-year historical averages. Geopolitical uncertainty in global energy transit corridors further underscored the strategic value of domestic supply, reinforcing floor support under prompt-month contracts.
From a market structure perspective, the price action represents a tactical, weather-driven repricing superimposed upon a broader fundamental rebalancing ahead of the winter heating season. While record open interest in Henry Hub derivatives reflects heightened institutional positioning and risk management activity, overhead technical resistance near key psychological price barriers continues to test momentum. Investors continue to monitor potential disruptions to Gulf Coast LNG feedgas flows, shoulder-season production variations, and updated winter long-range climate forecasts to evaluate whether the market balance can sustain higher pricing levels.
Technical Analysis of Natural Gas (NATGAS)
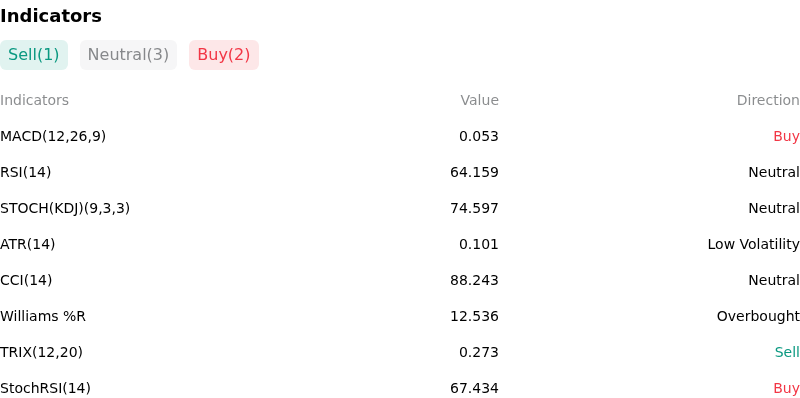
Technically, Natural Gas (NATGAS) shows a MACD (12,26,9) value of 0.053, indicating a buy signal. The RSI at 64.159 suggests neutral condition and the Williams %R at 12.536 suggests overbought condition. Please monitor closely.
More details about Natural Gas (NATGAS)
Recent Events and Risks:
- Record Dry Gas Supply Growth: U.S. Lower-48 dry gas production continues to hover near record highs of 114 Bcf/d, up over 5% year-over-year alongside expanded active gas drilling rig counts, creating sustained domestic oversupply pressure that restricts price recovery on front-month futures.
- Shoulder-Season Heating Demand Deterioration: Weather forecasts indicating above-average autumn temperatures across northern heating zones threaten to severely dampen early-season space-heating demand, accelerating the seasonal collapse in power burn before winter heating load materializes.
- Elevated Storage Inventories and Congestion Risk: Domestic working gas inventories remain more than 5% above their five-year seasonal average, with market projections targeting end-of-October stockpiles near 3,985 Bcf, raising fears of seasonal storage capacity stress and spot price liquidation.
- LNG Feedgas Disruptions and Feedstock Redirection: Unexpected throughput bottlenecks and maintenance disruptions at major Gulf Coast LNG export facilities risk curtailing daily feedgas intake below maximum capacity, diverting excess pipeline volumes back into already-saturated domestic storage hubs.
Recommended Articles


