


XRP (XRPUSD) Suddenly Goes down 1.10% on Sep 7: What You Need to Watch
XRP (XRPUSD) is down 1.10% at Sep 7 00:00(ET), now at $1.4062, with a 7-day up of 1.41%.
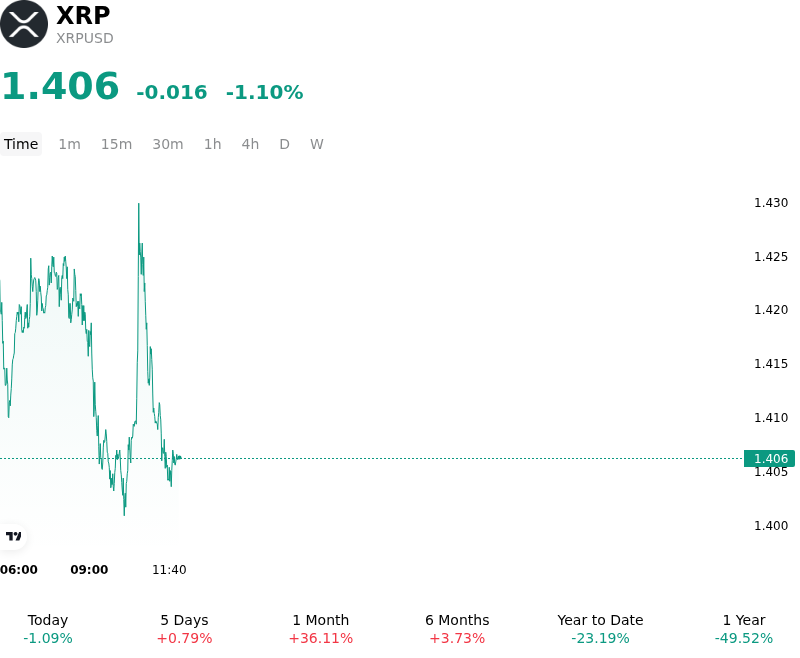
What is driving XRP (XRPUSD)’s stock price down today?
Institutional capital flows into XRP experienced a minor pullback as price action encountered persistent overhead resistance near key technical supply zones, prompting short-term profit taking following late-August gains. While spot digital asset markets benefited from steady spot ETF net inflows and improved baseline liquidity, market participation in XRP temporarily softened as speculative capital rotated into surging high-beta altcoins. The technical rejection near key resistance levels absorbed buying momentum, leading derivatives traders to unwind leveraged long positions and reduce directional exposure during the session.
Macro risk sentiment and regulatory expectations played a central role in framing market positioning. Traders adopted a cautious stance ahead of major mid-September policy catalysts, including the legislative cloture vote on the Digital Asset Market Clarity Act in the U.S. Senate and the Federal Reserve's upcoming monetary policy decision. Although long-term institutional confidence remains supported by potential commodity classification frameworks and expanding spot product adoption, short-term options and futures positioning reflected elevated hedging activity and tactical de-risking in anticipation of potential legislative delays.
On-chain dynamics further contributed to the consolidated trading environment, as market participants continued to digest the standard monthly escrow token release. While secondary exchange order books demonstrated sufficient depth to prevent broader downside contagion, the additional token supply placed a temporary ceiling on spot prices. Moving forward, institutional investors remain focused on institutional cross-border payment adoption, upcoming network upgrades to the XRP Ledger, and spot ETF flow stability, viewing current price consolidation as an event-driven pause within a broader macro-driven re-rating rather than a structural breakdown in market sentiment.
Technical Analysis of XRP (XRPUSD)
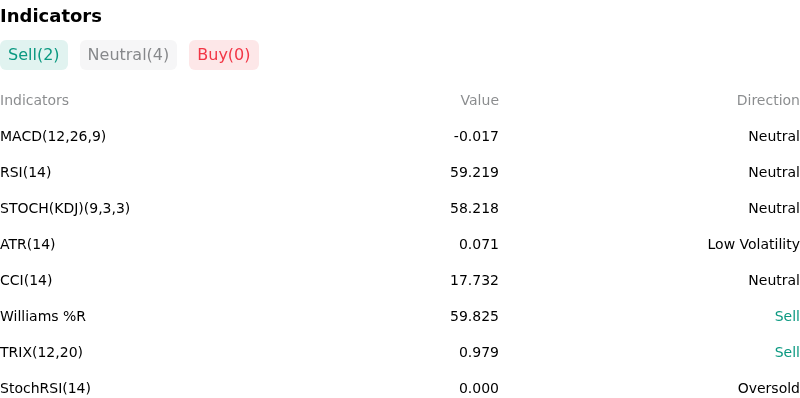
Technically, XRP (XRPUSD) shows a MACD (12,26,9) value of -0.017, indicating a neutral signal. The RSI at 59.149 suggests neutral condition and the Williams %R at 60.075 suggests sell condition. Please monitor closely.
More details about XRP (XRPUSD)
Recent Events and Risks:
- Macro Pressure and Long Liquidations: Worsening macroeconomic headwinds, driven by elevated U.S. Treasury yields and strong economic data, have dampened crypto risk appetite and triggered nearly $15 million in forced long-position liquidations in XRP derivatives, driving sharp intraday selling pressure.
- Whale Token Transfers and Escrow Supply Inflows: Scheduled periodic XRP escrow releases alongside substantial whale token transfers to major centralized exchange wallets have significantly heightened available spot market supply, creating an overhead selling burden that risks outpacing current buy-side order book depth.
- Cooling Institutional ETF Creation Flows: A recent pause in institutional creation momentum across spot XRP exchange-traded funds has reduced consistent buy-side absorption, increasing price sensitivity to downside volatility during periods of subdued spot volume.
- Key Technical Support Vulnerability: Rejections at overhead resistance levels and price consolidation near fragile support around $1.33–$1.40 leave XRP exposed to automated stop-loss cascades and accelerated leverage unwinds if local support fails.
Recommended Articles


