


Interactive Brokers Group Inc Stock (IBKR) Moved Up by 4.17% on Sep 3: What Signal Does It Send?
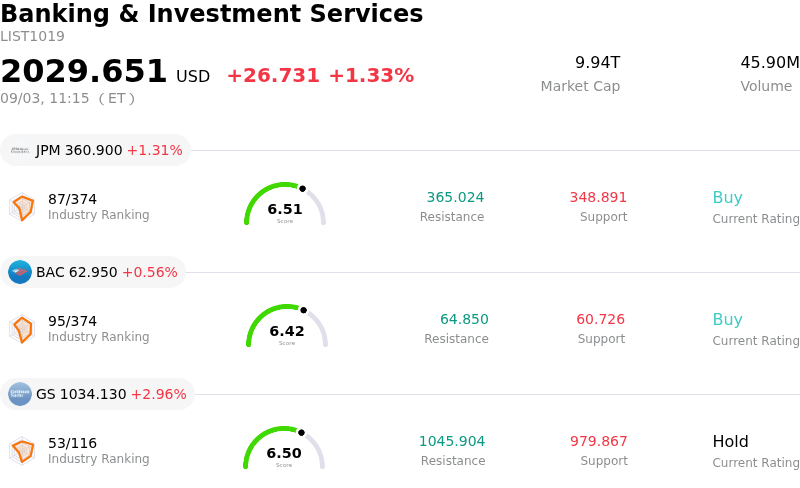
Interactive Brokers Group Inc (IBKR) moved up by 4.17%. The Banking & Investment Services sector is up by 1.33%. The company outperformed the industry. Top 3 stocks by turnover in the sector: JPMorgan Chase & Co (JPM) up 1.31%; Bank of America Corp (BAC) up 0.56%; Goldman Sachs Group Inc (GS) up 2.96%.
What is driving Interactive Brokers Group Inc (IBKR)’s stock price up today?
Interactive Brokers Group experienced strong upward momentum as market participants digested the brokerage firm's latest monthly operational metrics and re-engaged with top-tier financial service providers. The company demonstrated compelling top-line fundamental growth in its August metrics, highlighting a 35% year-over-year surge in total client accounts alongside a 35% expansion in client equity, bringing total customer assets close to the $1 trillion benchmark. Furthermore, client margin loan balances grew 41% year-over-year, providing a solid foundation for continued net interest margin resilience. Although daily average revenue trades experienced a slight sequential decline typical for late-summer trading, transaction activity remained substantially higher compared to the prior year period, reaffirming robust organic client acquisition and engagement.
The positive intraday price action also indicates that investors quickly looked past brief valuation hesitation following recent analyst coverage adjustments. Although select Wall Street research noted short-term multiple expansion after the stock's impressive year-to-date run, major investment banks reaffirmed buy-equivalent ratings with price targets well above current trading levels. Recent institutional portfolio disclosures further highlighted increased allocations from prominent institutional asset managers, indicating that professional investors remain focused on the firm's long-term market share gains, expanding global access, and best-in-class operating efficiency.
From a broader industry and macroeconomic standpoint, persistent market volatility across global asset classes continues to generate favorable tailwinds for electronic trading platforms. Interactive Brokers' technology-driven, low-cost operating model allows it to maintain superior gross margins while benefiting from elevated trading turnover and lucrative interest income on cash balances and margin loans. Coupled with strategic international platform expansions into emerging equities and local funding options, the company remains uniquely positioned to capture cross-border capital flows, driving strong investor demand and supporting the stock's upward trajectory.
Technical Analysis of Interactive Brokers Group Inc (IBKR)
Technically, Interactive Brokers Group Inc (IBKR) shows a MACD (12,26,9) value of -0.478, indicating a neutral signal. The RSI at 50.755 suggests neutral condition and the Williams %R at 57.656 suggests sell condition. Please monitor closely.
Media Coverage of Interactive Brokers Group Inc (IBKR)
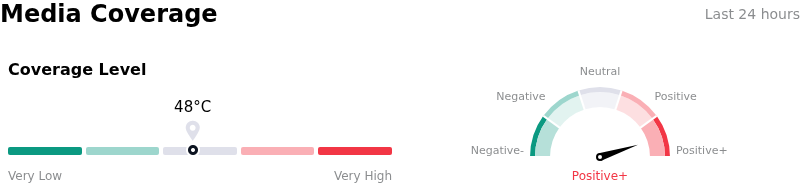
In terms of media coverage, Interactive Brokers Group Inc (IBKR) shows a coverage score of 48, indicating a moderate level of media attention. The overall market sentiment index is currently in extremely bullish zone.
Fundamental Analysis of Interactive Brokers Group Inc (IBKR)
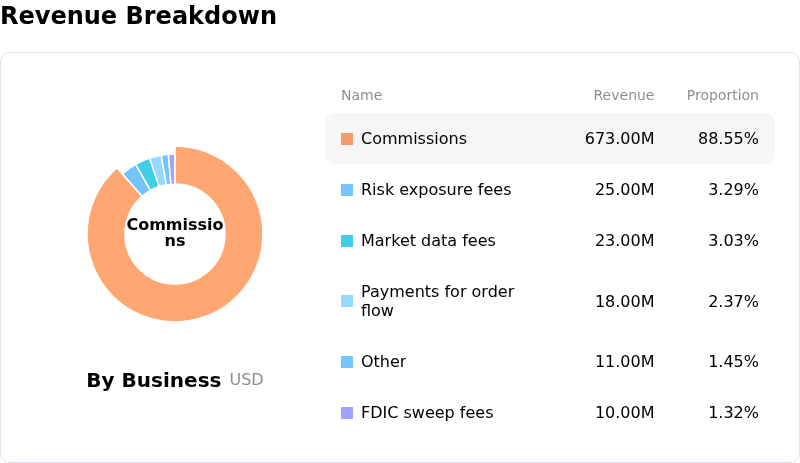
Interactive Brokers Group Inc (IBKR) is in the Banking & Investment Services industry. Its latest annual revenue is $10.00B, ranking 24 in the industry. The net profit is $984.00M, ranking 24 in the industry. Company Profile
Over the past month, multiple analysts have rated the company as Buy, with an average price target of $105.91, a high of $121.00, and a low of $72.18.
More details about Interactive Brokers Group Inc (IBKR)
Company Specific Risks:
- Analyst Downgrade and Valuation Compression: UBS downgraded Interactive Brokers from Buy to Neutral, citing elevated valuation multiples near 30x–36x forward earnings that leave shares vulnerable to market pullbacks if growth expectations are not exceeded.
- Sequential Deceleration in Trading Velocity: The brokerage reported a 3% month-over-month decline in August 2026 Daily Average Revenue Trades (DARTs) to 4.276 million, alongside a contraction in annualized cleared DARTs per client account from 180 to 168.
- Equity Overhang and Share Dilution Risk: Regulatory disclosures detailing Form S-3 shelf registration takedowns and Form 8-K filings for over 2.49 million Class A common shares alongside promotional equity awards have introduced potential market overhang and immediate per-share dilution risks.
- Net Interest Margin Sensitivity to Rate Cuts: With ending client margin loan balances reaching $101.5 billion, the firm's earnings remain highly sensitive to net interest income, exposing revenue streams to margin compression if central bank benchmark interest rates decline.
Recommended Articles


