


Solana (SOLUSD) Is up 1.29% on Sep 3: Why It Happened
Solana (SOLUSD) is up 1.29% at Sep 3 01:00(ET), now at $99.98, with a 7-day down of 7.44%.
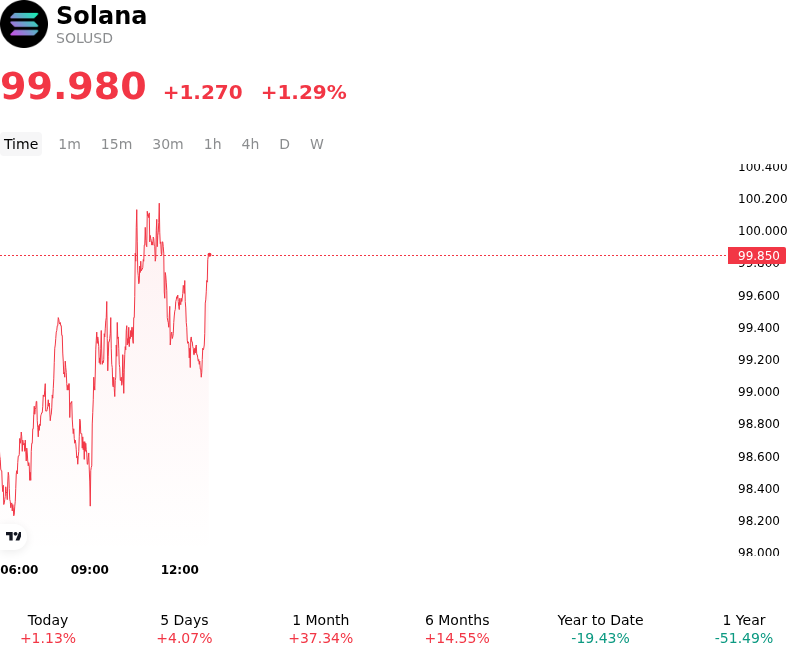
What is driving Solana (SOLUSD)’s stock price up today?
Solana experienced upward price momentum driven by sustained institutional capital inflows, accelerating ETF demand, and improving protocol fundamentals. Institutional interest in regulated spot Solana exchange-traded funds has served as a primary driver of liquidity, with spot SOL funds capturing substantial net inflows. The inclusion of staking-yield mechanisms in leading spot products continues to differentiate Solana from pure non-yielding digital assets, attracting yield-focused allocators within traditional finance. Furthermore, expanding distribution across major retail brokerage and wealth management platforms has broadened investor access, reinforcing structural demand for the asset.
Ecosystem developments and on-chain growth have further bolstered market sentiment. Market participants are responding constructively to upcoming network protocol enhancements, including the activation of the v1 transaction format designed to significantly expand transaction payload capacity without network downtime. High daily active address metrics, robust decentralized finance activity, and leadership in real-world asset tokenization inflows highlight sustained network usage. Additionally, a steady reduction in SOL balances on centralized exchanges suggests institutional accumulation and reduced immediate sell-side pressure.
From a market structure perspective, the price advance reflects a healthy reset in derivatives leverage and steady spot market buying. Technical stabilization above key moving averages has encouraged tactical buying from momentum and systematic funds. While capital flows remain supportive, institutional investors continue to monitor concentration risks within major ETF products, potential shifts in Federal Reserve monetary policy, and broader macroeconomic liquidity conditions that could influence risk-asset sentiment.
Technical Analysis of Solana (SOLUSD)
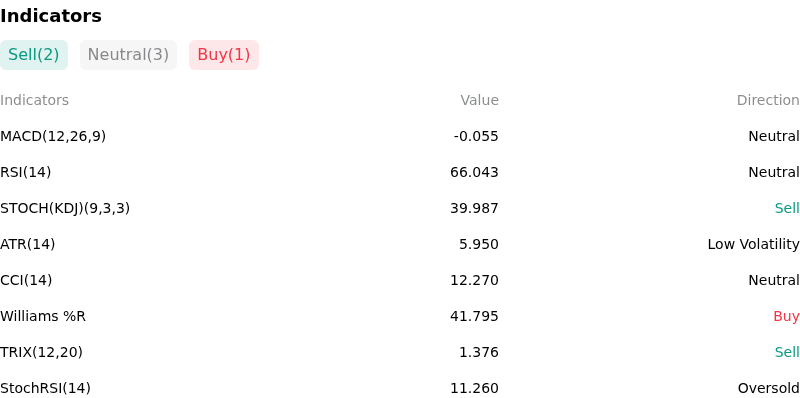
Technically, Solana (SOLUSD) shows a MACD (12,26,9) value of -0.055, indicating a neutral signal. The RSI at 66.043 suggests neutral condition and the Williams %R at 41.795 suggests buy condition. Please monitor closely.
More details about Solana (SOLUSD)
Recent Events and Risks:
- Macro-Driven Derivatives Liquidations: A sudden spike in crude oil prices and rising U.S. Treasury yields triggered over $369 million in market-wide crypto derivatives liquidations on September 2, dragging SOLUSD below the psychological $100 threshold to $98.47 and leaving open long positions vulnerable to cascading margin calls.
- Breakdown of Critical Support Levels: The breach below the key $100 support zone exposes Solana to immediate technical downside risk toward $96–$97 and $92–$94, with analysts highlighting that failure to reclaim $100 risks a deeper retracement toward the 50-day and 200-day EMAs near $85.79–$89.71.
- Fading Momentum Following Resistance Rejection: Repeated price rejections at upper resistance between $110 and $118.84 have cooled technical momentum indicators, with the RSI dipping below neutral midpoints and signaling fanning spot demand that could stall recovery attempts.
- Regulatory Overhead and Infrastructure Policy Risks: Fresh SEC proposals aimed at reforming blockchain transfer agent rules ahead of upcoming congressional debate over digital asset clarity have heightened policy uncertainty, creating downside risk for smart contract platforms and Layer-1 networks.
Recommended Articles


