


BNB (BNBUSD) Is up 1.04% on Sep 3: Here Is Why
BNB (BNBUSD) is up 1.04% at Sep 3 00:55(ET), now at $692.6, with a 7-day down of 2.18%.
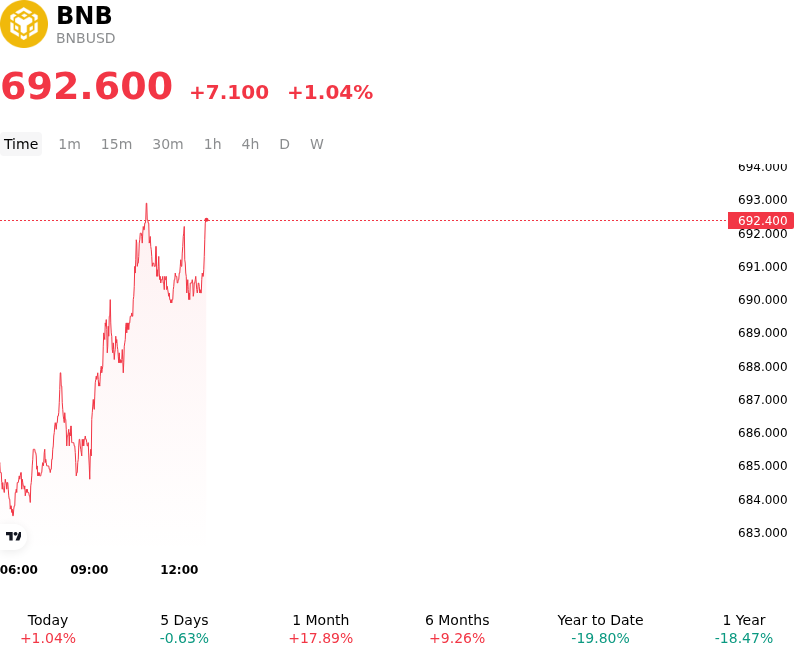
What is driving BNB (BNBUSD)’s stock price up today?
Capital flowed into BNB as strong network fundamentals and accelerating ecosystem activity boosted investor sentiment across the digital asset space. A major driver behind the renewed buying interest is the successful implementation of the Pasteur hard fork on the BNB Smart Chain. The protocol upgrade significantly enhanced network performance by doubling transaction execution throughput, expanding block gas capacity, and strengthening cross-chain bridge security and validator governance. By improving infrastructure reliability and reducing operational latency without increasing end-user transaction costs, the technical milestone reinforced long-term adoption metrics and heightened expectations for sustained gas fee burn dynamics across the chain.
Institutional participation and ecosystem expansion provided additional tailwinds for the asset. Market sentiment received a meaningful boost following institutional portfolio rebalancings, notably within prominent crypto asset management products like Grayscale’s Smart Contract Fund, where BNB achieved a leading allocation weight. Furthermore, persistent market optimism surrounding pending spot BNB ETF applications under regulatory review continues to anchor institutional demand expectations. Simultaneously, the BNB Chain ecosystem demonstrated robust growth in tokenized real-world assets and expanded integrations between traditional financial instruments and decentralized finance protocols, driving record user onboarding and platform transaction volumes.
From a macroeconomic and market structure perspective, the advance was reinforced by stabilizing broader liquidity conditions and favorable derivatives positioning. As expectations around Federal Reserve monetary policy pivot toward prospective rate reductions, risk appetite across major digital assets firming up provided a supportive macro backdrop. On derivatives exchanges, steady spot accumulation absorbed sell-side liquidity, triggering short covering and pushing perpetual futures funding rates back into positive territory. While macroeconomic indicators and regulatory developments remain key variables for institutional allocators to monitor, the confluence of technical network upgrades, structural institutional interest, and expanding ecosystem utility underpins the asset's current trajectory.
Technical Analysis of BNB (BNBUSD)
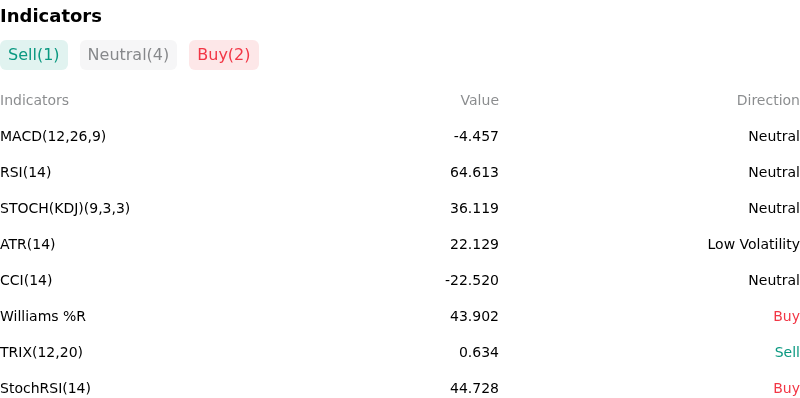
Technically, BNB (BNBUSD) shows a MACD (12,26,9) value of -4.457, indicating a neutral signal. The RSI at 64.613 suggests neutral condition and the Williams %R at 43.902 suggests buy condition. Please monitor closely.
More details about BNB (BNBUSD)
Recent Events and Risks:
- Macro Risk-Off and Crypto Market Spillover: Hawkish Federal Reserve policy commentary at Jackson Hole sparked a broad digital asset pull-back, driving Bitcoin below key support and dragging BNB down past $685 as capital rotated into traditional risk-off assets.
- Downside Liquidation Cascade Exposure: Futures position heatmaps indicate a heavy concentration of approximately $80 million in long liquidation leverage clustered below the $698–$702 price floor, creating heightened risk of an accelerated sell-off if support breaks.
- Technical Rejection and Seller Dominance: BNB faced strong technical rejection at the $700–$725 resistance zone following its post-upgrade momentum, with declining cumulative volume delta (CVD) pointing to weak spot buying power and distribution behavior.
- Ongoing European Regulatory Uncertainty: Market sentiment surrounding BNB remains constrained by regulatory scrutiny and operational authorization challenges in key European jurisdictions under the MiCA regulatory framework.
Recommended Articles


