


US Cocoa Futures (COCOA-F) Volatility Intensified on Sep 2: What to Watch
US Cocoa Futures (COCOA-F) is down 3.37% at Sep 2 07:30(ET), now at $6288.5, with a 7-day up of 7.98%.
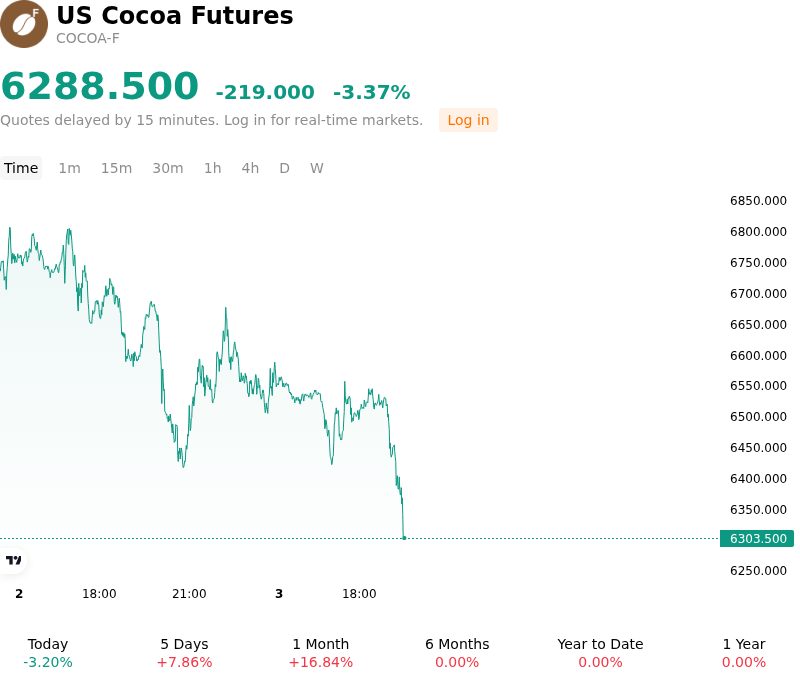
What is driving US Cocoa Futures (COCOA-F)’s stock price down today?
Cocoa futures experienced a sharp intraday decline as market participants locked in profits following a strong rally toward multi-month highs. The downward pressure was principally catalyzed by bearish spot supply developments, headlined by robust port arrivals in top producer Ivory Coast and a notable buildup in exchange-monitored inventories. Cumulative port delivery data from Côte d'Ivoire showed shipments for the marketing year reaching 2.14 million metric tons, representing a substantial year-over-year increase. This steady inflow of physical beans reinforced expectations of adequate spot availability, prompting traders to re-evaluate near-term pricing after the recent run-up.
Compounding the negative momentum, ICE-monitored cocoa inventories climbed to two-year highs, surpassing 3.4 million bags. The visible expansion in warehouse stocks provided concrete evidence that immediate physical tightness has abated, encouraging systematic selling and long liquidation across institutional trading desks. Furthermore, strong late-season harvest figures from Ghana, where full-year output rebounded significantly from the prior season, confirmed that current marketing year supply balances remain comfortable despite ongoing concerns regarding bean quality.
While prompt supply availability and inventory accumulation drove the intraday sell-off, market participants continue to weigh these short-term factors against a tightening medium-term outlook. Emerging assessments for the upcoming main crop indicate potential production headwinds across West Africa, driven by poor pod development, persistent disease pressure from black pod fungal outbreaks, and the threat of dry conditions associated with the El Niño climate pattern. As a result, market participants view the pullback as a liquidity-driven correction and profit-taking reaction rather than a fundamental shift in the broader supply-demand landscape.
Technical Analysis of US Cocoa Futures (COCOA-F)
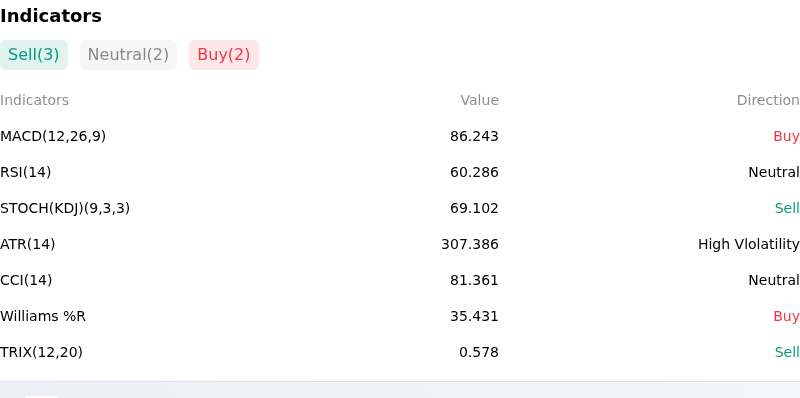
Technically, US Cocoa Futures (COCOA-F) shows a MACD (12,26,9) value of 86.243, indicating a buy signal. The RSI at 60.286 suggests neutral condition and the Williams %R at 35.431 suggests buy condition. Please monitor closely.
More details about US Cocoa Futures (COCOA-F)
Recent Events and Risks:
- Industrial Demand Destruction and Processing Softness: Sustained consumer resistance to high confectionery retail prices and elevated manufacturer input costs continue to depress global cocoa grindings across major processing hubs, signaling persistent demand rationing and deferred bean purchasing by chocolate manufacturers.
- Inventory Rebuilding and Supply Surplus Projections: Forecasts of a transition toward a net global cocoa surplus, reinforced by recovering mid-crop deliveries and maturing acreage in secondary producers like Ecuador, are rebuilding stock-to-grind ratios and eroding long-term scarcity premiums across forward curves.
- Market Illiquidity and Algorithmic Liquidation Stress: High exchange margin requirements and reduced order book depth expose cocoa futures to exaggerated intraday downside volatility, amplifying price drops through automated stop-loss selling and forced speculative long unwinding when key support thresholds are broken.
- Accelerating Port Deliveries and Warehouse Builds: Periodic spikes in cocoa bean arrivals at key West African export terminals alongside localized builds in ICE-monitored warehouse inventories ease immediate spot supply tightness, prompting short-term profit-taking and price pullbacks in front-month contracts.
Recommended Articles


