


Newmont Corporation Stock (NEM) Moved Up by 3.18% on Aug 21: What Signal Does It Send?
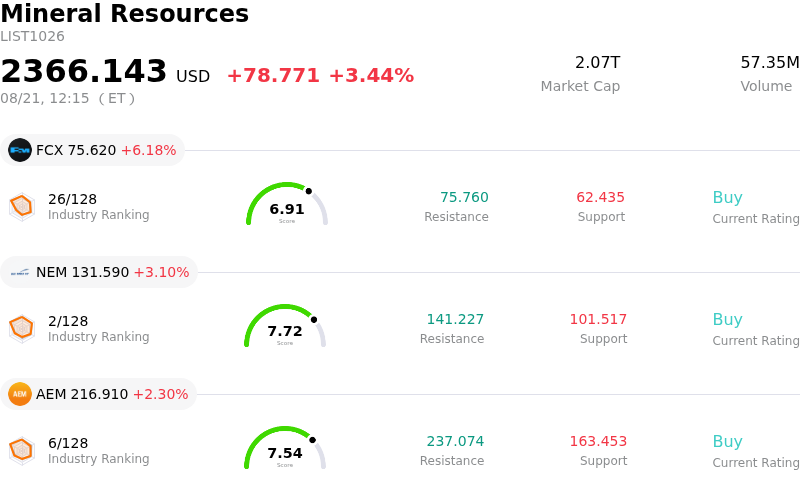
Newmont Corporation (NEM) moved up by 3.18%. The Mineral Resources sector is up by 3.44%. The company underperformed the industry. Top 3 stocks by turnover in the sector: Freeport-McMoRan Inc (FCX) up 6.18%; Newmont Corporation (NEM) up 3.10%; Agnico Eagle Mines Ltd (AEM) up 2.30%.
What is driving Newmont Corporation (NEM)’s stock price up today?
Newmont Corporation experienced strong upward momentum, driven primarily by a robust rally in underlying spot gold prices. Precious metal markets saw heightened demand following recent macroeconomic developments, including announcements from the U.S. Treasury regarding expanded government bond buyback operations. This liquidity injection pushed long-term bond yields lower and exerted downward pressure on the U.S. Dollar Index, enhancing the attractiveness of non-yielding assets like gold. In addition, broader market sentiment was supported by persistent inflation concerns and central bank buying, providing a strong commodity-level tailwind for top-tier unhedged precious metal producers.
Company-specific fundamentals and favorable Wall Street commentary further reinforced investor confidence in Newmont. Equity analysts recently raised full-year earnings estimates for the miner, reflecting optimism over operational cost discipline, strong realized gold prices, and healthy cash flow generation. Following a recent earnings report where the company surpassed consensus profitability estimates, sell-side sentiment has remained constructive. Investors continue to respond positively to Newmont’s execution on its key capital expansion projects, solid operational margins, and commitment to maintaining a robust balance sheet while delivering returns through disciplined capital allocation.
From a market strategy perspective, the stock benefited from broader institutional portfolio reallocation into the basic materials sector. An expanding premium in gold spot prices combined with improving cost structures across Newmont’s global mining portfolio has reignited institutional interest. While short-term technical indicators show strong momentum after holding above major moving average support levels, long-term fundamentals remain anchored to underlying commodity market trajectories and global monetary policy expectations.
Technical Analysis of Newmont Corporation (NEM)
Technically, Newmont Corporation (NEM) shows a MACD (12,26,9) value of 4.372, indicating a buy signal. The RSI at 75.907 suggests buy condition and the Williams %R at 2.134 suggests overbought condition. Please monitor closely.
Media Coverage of Newmont Corporation (NEM)
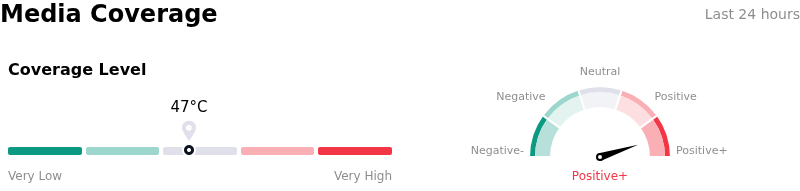
In terms of media coverage, Newmont Corporation (NEM) shows a coverage score of 47, indicating a moderate level of media attention. The overall market sentiment index is currently in extremely bullish zone.
Fundamental Analysis of Newmont Corporation (NEM)
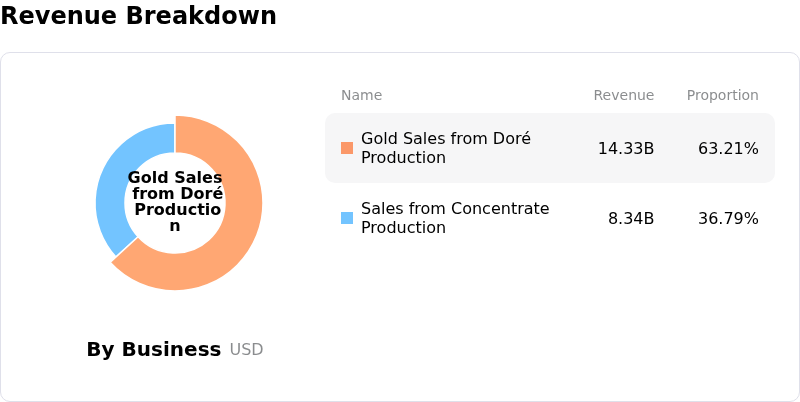
Newmont Corporation (NEM) is in the Mineral Resources industry. Its latest annual revenue is $22.67B, ranking 8 in the industry. The net profit is $7.08B, ranking 3 in the industry. Company Profile
Over the past month, multiple analysts have rated the company as Buy, with an average price target of $133.45, a high of $205.00, and a low of $64.32.
More details about Newmont Corporation (NEM)
Company Specific Risks:
- Technical Stretch and Overbought Volatility: Following a steep multi-week rally, technical indicators including the Relative Strength Index (RSI) entered overbought territory above 73, exposing the stock to sharp intraday profit-taking and increased vulnerability during broader market pullbacks.
- Executive Insider Equity Liquidations: Recent SEC Form 4 disclosures showed coordinated insider share sales among executive management, highlighted by Chief Financial Officer Brian Tabolt liquidating 28.07% of his direct equity holdings, introducing market supply pressure and institutional caution.
- Production Guidance Cuts and AISC Cost Pressures: Consensus earnings estimates for upcoming quarters have faced downward revisions following management forecasts of lower full-year attributable gold production, alongside persistent upward pressures on All-In Sustaining Costs (AISC).
- Spot Bullion Sensitivity and Yield Co-Movements: Intraday price movements remain heavily tied to spot gold fluctuations, where any firming in U.S. Treasury yields or rate expectations increases the opportunity cost of holding non-yielding assets and triggers fast sector-wide selling.
Recommended Articles


