


Banco Santander SA Stock (SAN) Moved Down by 3.93% on Jul 23: Key Drivers Unveiled
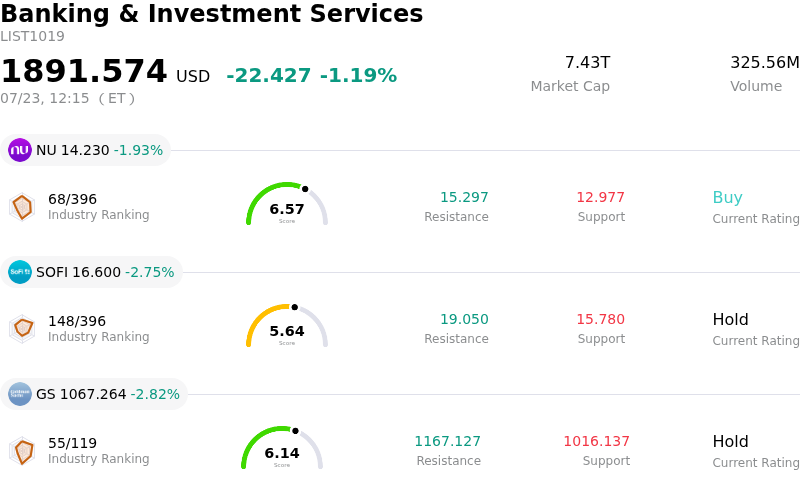
Banco Santander SA (SAN) moved down by 3.93%. The Banking & Investment Services sector is down by 1.19%. The company underperformed the industry. Top 3 stocks by turnover in the sector: Nu Holdings Ltd (NU) down 1.93%; SoFi Technologies Inc (SOFI) down 2.75%; Goldman Sachs Group Inc (GS) down 2.82%.
What is driving Banco Santander SA (SAN)’s stock price down today?
Santander is facing significant downward pressure following its latest quarterly earnings release, which revealed a challenging landscape for net interest income. While the headline figures showed resilience, a closer examination of the margins in its core European markets indicates that the tailwinds from previous interest rate hikes are beginning to fade. This narrowing of margins has prompted a wave of profit-taking from investors who had previously banked on continued expansion in lending profitability.
Compounding the concerns is a notable increase in loan-loss provisions, particularly within the bank's Latin American divisions. The Brazilian market, a significant contributor to Santander's global revenue, is showing signs of credit stress as inflationary pressures weigh on consumer repayment capacity. This rise in potential defaults has forced the bank to set aside more capital, directly impacting its bottom-line performance and overshadowing its efforts to streamline operational costs.
The broader European banking sector is also experiencing heightened sensitivity to shifting monetary policy signals. Recent updates from central banks suggest a more cautious approach to future rate paths, leading to fears that the era of exceptional bank earnings may be nearing an end. For a diversified entity like Santander, these macro shifts create valuation headwinds that are difficult to ignore, especially when combined with localized regulatory uncertainties in Spain regarding banking levies.
Institutional sentiment has shifted as several analysts adjusted their outlooks to reflect a more conservative growth forecast for the remainder of the year. The stock's intraday volatility reflects a broader de-risking strategy among major portfolio managers who are reacting to the confluence of decelerating revenue growth and rising regional risks. Although the company remains committed to its shareholder distribution targets, the immediate focus of the market has shifted toward the sustainability of its earnings power in a cooling global economy.
Technical Analysis of Banco Santander SA (SAN)
Technically, Banco Santander SA (SAN) shows a MACD (12,26,9) value of -0.152, indicating a neutral signal. The RSI at 55.423 suggests neutral condition and the Williams %R at 59.633 suggests sell condition. Please monitor closely.
Fundamental Analysis of Banco Santander SA (SAN)
Banco Santander SA (SAN) is in the Banking & Investment Services industry. Its latest annual revenue is $65.95B, ranking 5 in the industry. The net profit is $15.90B, ranking 5 in the industry. Company Profile
Over the past month, multiple analysts have rated the company as Buy, with an average price target of $14.66, a high of $15.50, and a low of $13.82.
More details about Banco Santander SA (SAN)
Company Specific Risks:
- UK Regulatory Contingency: Recent analyst commentary highlights escalating concerns regarding the FCA's investigation into motor finance commissions, where Banco Santander faces significant potential liabilities that could necessitate a material increase in litigation provisions.
- Spanish Windfall Tax Permanence: Increased political pressure within the Spanish legislature to institutionalize the temporary bank levy as a permanent fiscal measure creates a structural risk to the bank’s return on equity (RoE) and its ability to sustain current dividend payout ratios.
- Yield Curve Compression: Volatility in the Eurozone sovereign debt market and the high probability of an ECB rate cut in the immediate term are triggering concerns over net interest margin (NIM) erosion, particularly as the bank’s asset sensitivity leaves it vulnerable to falling benchmark rates.
- Asset Quality Weakness: Intraday fluctuations reflect growing investor anxiety over rising delinquency trends in the U.S. and Brazilian retail portfolios, where inflationary pressures on consumers are driving higher loan-loss provisions and impacting the bank’s overall credit cost outlook.
Recommended Articles


