


Solana (SOLUSD) Suddenly Goes down 1.33% on Jul 16: What's Driving This
Solana (SOLUSD) is down 1.33% at Jul 16 03:40(ET), now at $75.36, with a 7-day down of 2.32%.
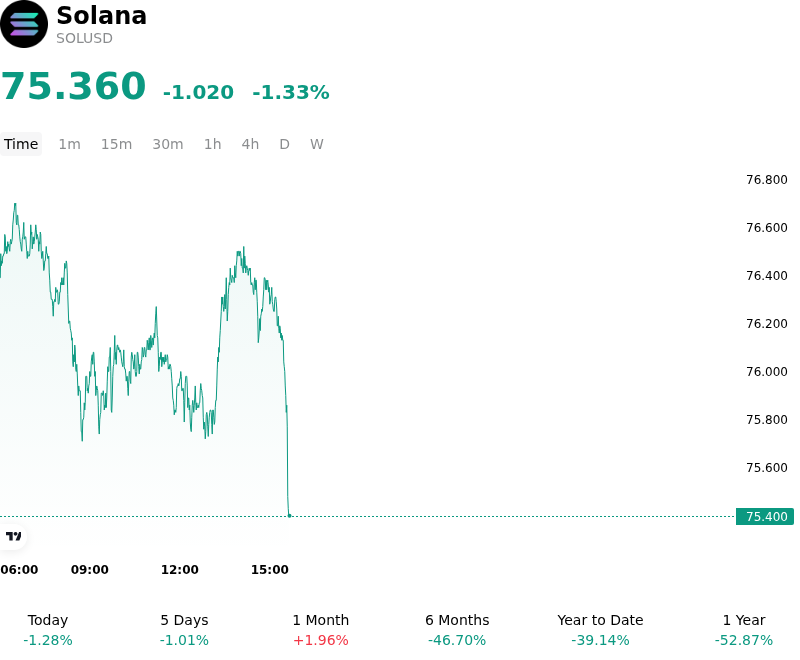
What is driving Solana (SOLUSD)’s stock price down today?
Solana’s intraday weakness is primarily driven by a broader recalibration of risk-weighted assets following a hawkish shift in global liquidity expectations. As US Treasury yields climbed during the session, the appeal of high-beta digital assets diminished, prompting institutional desks to trim exposure in favor of cash and short-duration fixed income. This macro-driven pressure was exacerbated by a strengthening US Dollar Index, which traditionally serves as a headwind for the entire crypto complex, particularly for assets like Solana that have seen significant year-to-date appreciation and high-velocity capital inflows.
Within the crypto-native landscape, the decline reflects a period of tactical profit-taking following recent network milestones and ecosystem expansions. While on-chain metrics and active user counts remain robust, the temporary absence of fresh catalysts to drive immediate upside led to a softening of momentum. The derivatives market saw a notable uptick in long liquidations, suggesting that overleveraged positions were forced to close as prices dipped below key technical support levels. This deleveraging event accelerated the move, creating a localized feedback loop of selling pressure despite the underlying ecosystem's healthy fundamental trajectory and continued developer activity.
Institutional demand through regulated investment vehicles also showed signs of exhaustion. After several weeks of steady inflows into decentralized finance and layer-one ecosystem products, capital flows have temporarily stagnated. Investors appear to be moving into a defensive posture ahead of upcoming economic data releases, prioritizing capital preservation over growth-oriented tokens. This shift in sentiment is characteristic of mid-year rebalancing, where portfolio managers lock in gains from outperforming assets to realign with broader risk mandates and volatility targets.
Furthermore, the intraday volatility was heightened by liquidity thinning across major exchanges. As buy-side depth retreated, even moderate sell orders resulted in more pronounced price adjustments. This environment highlights the ongoing sensitivity of Solana to shifts in global macro-financial conditions and the high correlation between high-throughput blockchain assets and general risk appetite. While the long-term narrative regarding institutional adoption and real-world asset tokenization remains intact, the current price action underscores the dominance of interest rate expectations and dollar strength in dictating short-term capital flows.
Technical Analysis of Solana (SOLUSD)
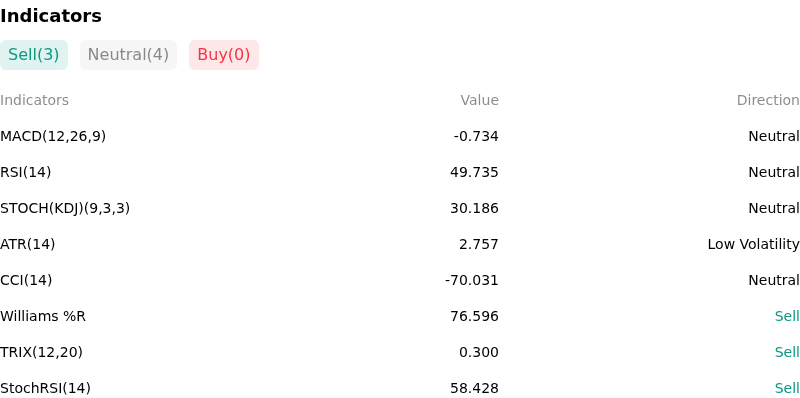
Technically, Solana (SOLUSD) shows a MACD (12,26,9) value of -0.734, indicating a neutral signal. The RSI at 49.735 suggests neutral condition and the Williams %R at 76.596 suggests sell condition. Please monitor closely.
More details about Solana (SOLUSD)
Recent Events and Risks:
- Institutional Capital Rotation: The recent regulatory pivot toward the approval of Spot Ethereum ETFs in the United States has catalyzed a capital rotation away from Solana, as market participants hedge against the "Ethereum-killer" narrative in favor of assets with more immediate institutional on-ramps and regulatory clarity.
- Concentrated Liquidation Risk: High levels of Open Interest (OI) in Solana perpetual futures, combined with elevated funding rates over the last 48 hours, have created a precarious market structure where a minor price retracement could trigger a cascading "long squeeze," forcing automated liquidations and rapid intraday price depreciation.
- FTX Estate Supply Overhang: Persistent concerns regarding the scheduled liquidation and auctioning of SOL tokens held by the FTX bankruptcy estate continue to provide a structural cap on price appreciation, as traders anticipate sudden influxes of secondary market supply that could overwhelm current buy-side liquidity.
- Network Performance and Upgrade Risk: While recent congestion issues have stabilized, the ongoing rollout of core protocol updates and the high-stakes transition toward the Firedancer validator client introduce significant technical execution risks; any unforeseen bugs or validator consensus failures could lead to network downtime and a subsequent loss of confidence in Solana's uptime reliability.
Recommended Articles


