


Bitcoin (BTCUSD) Is up 1.05% on Jul 15: What Are the Risk Factors?
Bitcoin (BTCUSD) is up 1.05% at Jul 15 02:35(ET), now at $65219.99, with a 7-day up of 5.08%.
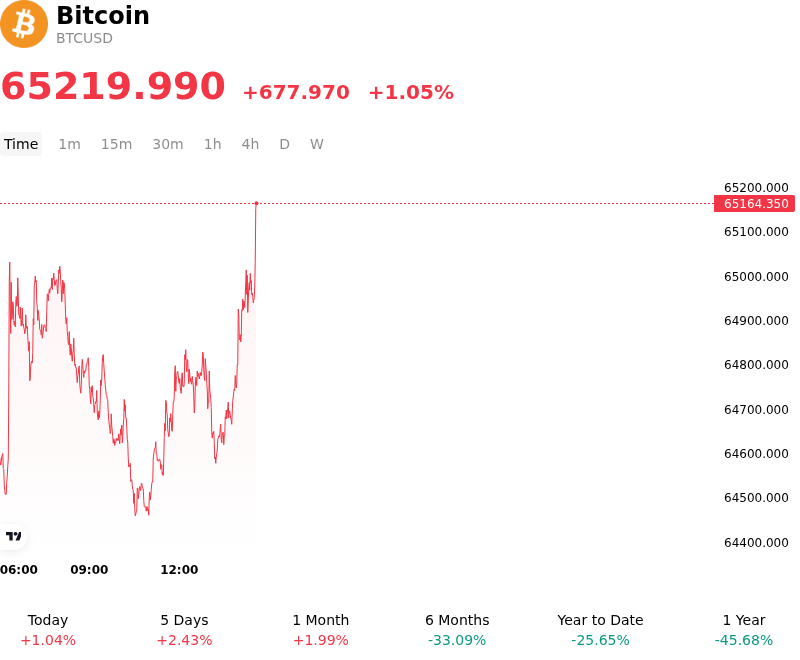
What is driving Bitcoin (BTCUSD)’s stock price up today?
The appreciation in Bitcoin today reflects a confluence of favorable macroeconomic signals and a resurgence in spot ETF demand, signaling a shift toward risk-on sentiment in the digital asset space. Investor appetite was largely bolstered by softer-than-expected US economic data, which has reinforced expectations that the Federal Reserve will maintain a more accommodative monetary stance through the second half of 2026. This macro backdrop has exerted downward pressure on the US Dollar Index and Treasury yields, enhancing the attractiveness of non-yielding, scarce assets like Bitcoin as a hedge against long-term currency debasement.
Institutional capital flows remain a primary catalyst for the current price action. Mid-month rebalancing by large-scale asset managers and consistent net inflows into US-listed spot Bitcoin ETFs have provided a stable liquidity floor, absorbing intraday sell-side pressure. The participation of sovereign wealth funds and state pension funds, which has become a more prominent narrative this year, continues to transition Bitcoin from a speculative vehicle to a core component of diversified institutional portfolios. This structural shift in ownership is reducing the available liquid supply on exchanges, making the market more sensitive to localized spikes in demand.
Intraday volatility was further amplified by dynamics in the derivatives market. Data suggests a cluster of short liquidations occurred as Bitcoin broke through key technical resistance levels, creating a feedback loop that accelerated the upward move. The narrowing of the basis trade spread also indicates that market participants are shifting from market-neutral strategies toward directional long exposure, anticipating a continuation of the mid-year cyclical rally. On-chain metrics support this view, showing a marked increase in whale accumulation and a decrease in the volume of coins held on exchange platforms.
While the immediate outlook remains constructive, market participants are closely monitoring global liquidity conditions and potential regulatory shifts. The interplay between traditional finance and digital asset markets has deepened, meaning that shifts in liquidity—particularly those driven by central bank policy in Europe and Asia—could introduce secondary volatility. For now, the combination of a weakening dollar and sustained institutional adoption appears to be the dominant driver of the current momentum, reflecting a broader structural trend rather than a temporary event-driven reaction.
Technical Analysis of Bitcoin (BTCUSD)
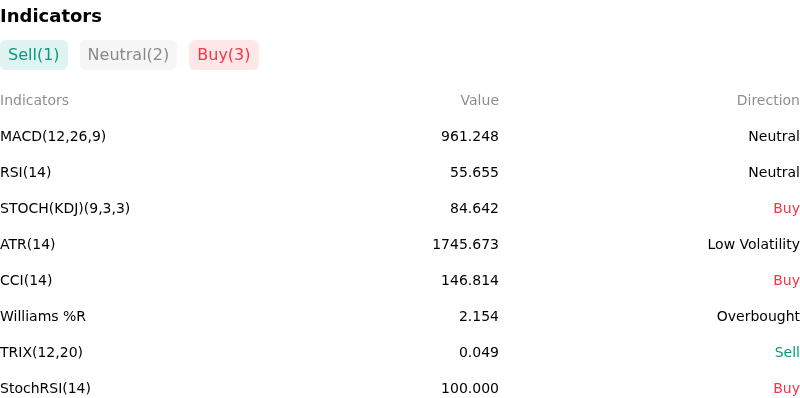
Technically, Bitcoin (BTCUSD) shows a MACD (12,26,9) value of 961.248, indicating a neutral signal. The RSI at 55.655 suggests neutral condition and the Williams %R at 2.154 suggests overbought condition. Please monitor closely.
More details about Bitcoin (BTCUSD)
Recent Events and Risks:
- Hawkish Monetary Policy Signals: Recent FOMC minutes have revealed that Federal Reserve officials are increasingly concerned about stagnant progress on inflation, with some participants expressing a willingness to tighten policy further if necessary, leading to a rise in Treasury yields and a stronger US Dollar that pressures Bitcoin's price.
- Regulatory Friction Regarding SAB 121: The potential presidential veto of the resolution to overturn the SEC’s Staff Accounting Bulletin No. 121 remains a significant downside risk, as maintaining these restrictive accounting rules would continue to prevent highly regulated banks from providing large-scale digital asset custody services.
- Leverage and Liquidation Clusters: Market data indicates a high concentration of leveraged long positions with liquidation triggers situated between the $67,000 and $68,500 levels; a failure to hold current support could spark a cascading "long squeeze" following the recent rejection at the $71,000 psychological resistance.
- Spot ETF Demand Exhaustion: Following a streak of heavy inflows, any notable deceleration or shift toward net outflows in U.S. spot Bitcoin ETFs is viewed by analysts as a primary risk for a near-term correction, as the market currently relies heavily on institutional buy-side pressure to offset ongoing distribution by miners and long-term holders.
Recommended Articles


