


Solana (SOLUSD) Is up 1.08% on Jul 15: Here Is Why
Solana (SOLUSD) is up 1.08% at Jul 15 00:50(ET), now at $77, with a 7-day up of 1.09%.
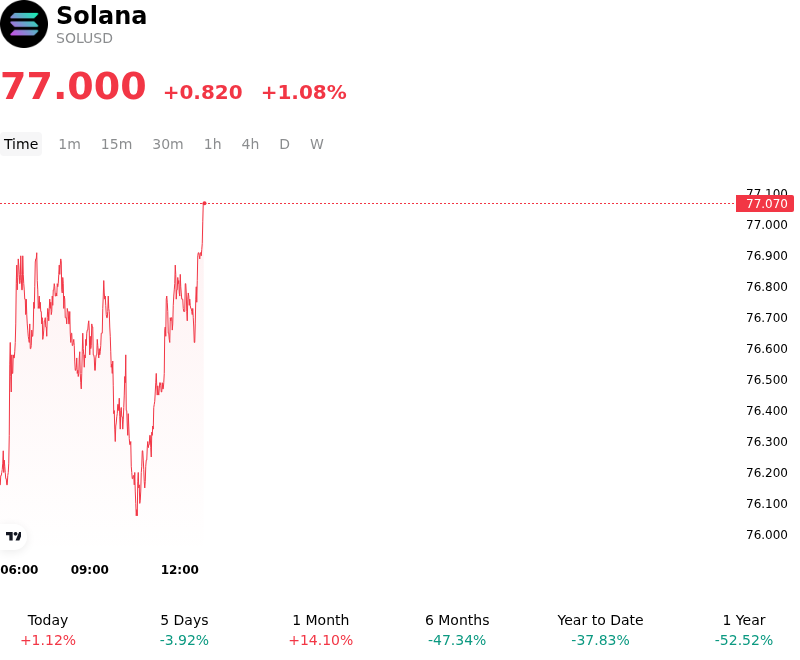
What is driving Solana (SOLUSD)’s stock price up today?
The advance in Solana is primarily driven by shifting expectations regarding institutional access and the continued expansion of the network's decentralized physical infrastructure projects. Market participants are increasingly focusing on the potential for a spot Solana ETF, which has led to a sustained bid as large-scale allocators position for improved liquidity and regulatory clarity. This institutional interest is being reinforced by high transaction volumes on the network, particularly within the DePIN and RWA sectors, which have matured significantly over the last several quarters.
Macroeconomic conditions have also provided a constructive backdrop for high-beta digital assets. With the Federal Reserve maintaining a stable policy stance and the US Dollar Index showing signs of consolidation, capital has rotated into established Layer-1 ecosystems that demonstrate clear utility and fee generation. The relative stability in Treasury yields has allowed risk appetite to remain resilient, favoring Solana’s high-throughput architecture over more congested legacy networks.
From a technical and liquidity perspective, the intraday volatility was exacerbated by a squeeze in the derivatives market. Elevated open interest in perpetual futures suggests that a cluster of short positions was liquidated as the price breached key resistance levels, creating a temporary feedback loop of buying pressure. This move was supported by consistent spot buying on major exchanges, indicating that the movement is not purely speculative but backed by structural accumulation from medium-term holders.
Furthermore, the ecosystem's recent focus on enterprise-grade performance and security upgrades has bolstered confidence among corporate treasuries considering SOL as a strategic digital asset. As the regulatory environment in the United States moves toward a more defined framework for digital commodities, Solana’s position as a leading smart-contract platform makes it a primary beneficiary of capital flows seeking exposure beyond Bitcoin and Ethereum. Investors remain attentive to upcoming network milestones and potential shifts in global liquidity that could further catalyze this growth trajectory.
Technical Analysis of Solana (SOLUSD)
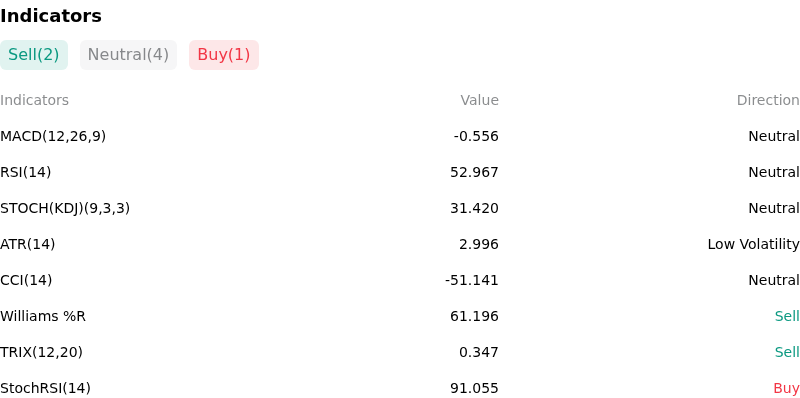
Technically, Solana (SOLUSD) shows a MACD (12,26,9) value of -0.556, indicating a neutral signal. The RSI at 52.967 suggests neutral condition and the Williams %R at 61.196 suggests sell condition. Please monitor closely.
More details about Solana (SOLUSD)
Recent Events and Risks:
- Hawkish Federal Reserve Outlook: Following the June 12 FOMC meeting, the "dot plot" revealed a shift toward only one projected interest rate cut for 2024, which has strengthened the U.S. Dollar and increased Treasury yields, leading to a risk-off sentiment that disproportionately affects high-beta assets like Solana.
- Persistent Regulatory Classification: Unlike Ethereum, which has seen a shift in regulatory tone, Solana continues to be categorized as an unregistered security in the SEC's active litigation against major exchanges; this maintains a high level of legal uncertainty and prevents significant institutional capital from entering SOL-specific products in the near term.
- Liquidation Cluster Pressure: Market data indicates a significant concentration of long-position liquidation triggers situated just below the current $145–$150 price range; a breach of these local support levels risks a localized "long squeeze," where automated sell orders could accelerate intraday price declines.
- Slowing Ecosystem Velocity: There is growing concern among traders regarding the sustainability of the recent meme-coin frenzy on the Solana network; a measurable decline in decentralized exchange (DEX) volumes and a cooling of activity on deployment platforms like Pump.fun could lead to reduced network fees and lower organic demand for SOL.
Recommended Articles


