


Wells Fargo & Co Stock (WFC) Moved Down by 3.13% on Jul 14: What Signal Does It Send?
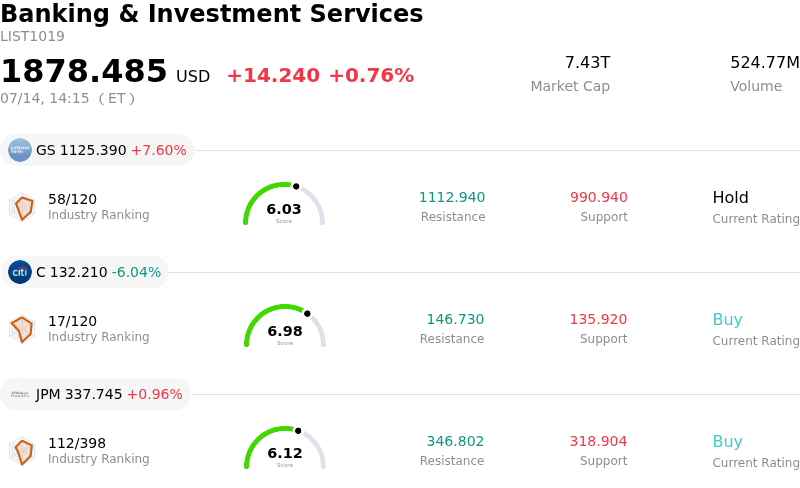
Wells Fargo & Co (WFC) moved down by 3.13%. The Banking & Investment Services sector is up by 0.76%. The company underperformed the industry. Top 3 stocks by turnover in the sector: Goldman Sachs Group Inc (GS) up 7.60%; Citigroup Inc (C) down 6.04%; JPMorgan Chase & Co (JPM) up 0.96%.
What is driving Wells Fargo & Co (WFC)’s stock price down today?
Wells Fargo's recent performance reflects broader concerns regarding the sustainability of net interest income in a shifting interest rate environment. The downward pressure on the stock follows the release of quarterly financial results that highlighted a narrowing net interest margin. As the Federal Reserve signals a potential pivot or pause in its monetary tightening cycle, investors are increasingly skeptical of the bank's ability to maintain the high margins seen in previous quarters, particularly as deposit costs continue to climb across the sector.
Beyond the top-line figures, the bank's non-interest expense trajectory remains a focal point for institutional investors. Despite management's ongoing efforts to streamline operations and resolve legacy regulatory issues, the persistence of elevated legal and compliance costs suggests that the path toward achieving a competitive efficiency ratio is longer than initially anticipated. Market sentiment was further dampened by a cautious revision to full-year guidance, where the company signaled that inflationary pressures on wages and investments in technology could offset recent productivity gains.
The regulatory overhang, specifically the long-standing asset cap imposed by the Federal Reserve, continues to act as a significant headwind. While there have been periodic reports of progress toward meeting the requirements for the cap's removal, the lack of a definitive timeline limits the bank's ability to aggressively expand its balance sheet compared to its larger peers. This structural constraint, combined with a conservative outlook on credit quality as provisions for loan losses are adjusted to reflect economic uncertainty, has led to a defensive rotation among portfolio managers who are currently prioritizing banks with fewer operational hurdles.
Broader macroeconomic signals, including recent labor market data and inflation prints, have also contributed to the intraday volatility. The flattening yield curve has historically pressured the profitability of commercial banks that rely heavily on traditional lending activities. For Wells Fargo, which has a significant footprint in the mortgage and consumer lending sectors, the combination of slowing loan demand and rising credit costs presents a challenging near-term environment that overshadows the bank's aggressive capital return programs, such as share buybacks and dividends.
Technical Analysis of Wells Fargo & Co (WFC)
Technically, Wells Fargo & Co (WFC) shows a MACD (12,26,9) value of 0.247, indicating a buy signal. The RSI at 63.953 suggests neutral condition and the Williams %R at 14.876 suggests overbought condition. Please monitor closely.
Media Coverage of Wells Fargo & Co (WFC)
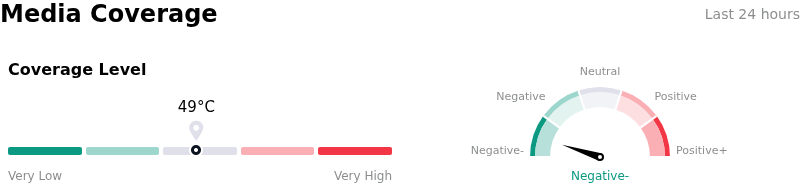
In terms of media coverage, Wells Fargo & Co (WFC) shows a coverage score of 49, indicating a moderate level of media attention. The overall market sentiment index is currently in extremely bearish zone.
Fundamental Analysis of Wells Fargo & Co (WFC)
Wells Fargo & Co (WFC) is in the Banking & Investment Services industry. Its latest annual revenue is $81.45B, ranking 3 in the industry. The net profit is $20.29B, ranking 4 in the industry. Company Profile
Over the past month, multiple analysts have rated the company as Buy, with an average price target of $99.75, a high of $113.00, and a low of $85.00.
More details about Wells Fargo & Co (WFC)
Company Specific Risks:
- Net Interest Income (NII) Guidance Shortfall: Recent quarterly disclosures indicate that elevated deposit betas and persistent migration toward high-yield certificates of deposit are compressing net interest margins more severely than previously modeled, leading to a downward revision of full-year NII guidance.
- Persistent Asset Cap Restrictions: Recent updates from Federal regulators suggest that the $1.95 trillion asset growth limit remains in place due to unresolved deficiencies in the bank’s risk management framework, preventing the firm from scaling its balance sheet to capitalize on current lending opportunities.
- Commercial Real Estate (CRE) Credit Deterioration: Sharp increases in non-performing assets within the office-sector portfolio have necessitated a significant spike in provisions for credit losses, as appraisal values for urban commercial properties continue to face steep downward adjustments.
- Escalating Regulatory Compliance Costs: Ongoing expenses related to the remediation of legacy consent orders and the implementation of enhanced internal controls are driving non-interest expenses higher, offsetting recent cost-cutting initiatives and pressuring the bank's efficiency ratio.
Recommended Articles


