


Morgan Stanley Stock (MS) Moved Up by 3.45% on Jul 6: Drivers Behind the Movement
Morgan Stanley (MS) moved up by 3.45%. The Banking & Investment Services sector is up by 1.50%. The company outperformed the industry. Top 3 stocks by turnover in the sector: SoFi Technologies Inc (SOFI) up 4.52%; JPMorgan Chase & Co (JPM) up 0.47%; Bank of America Corp (BAC) up 1.28%.
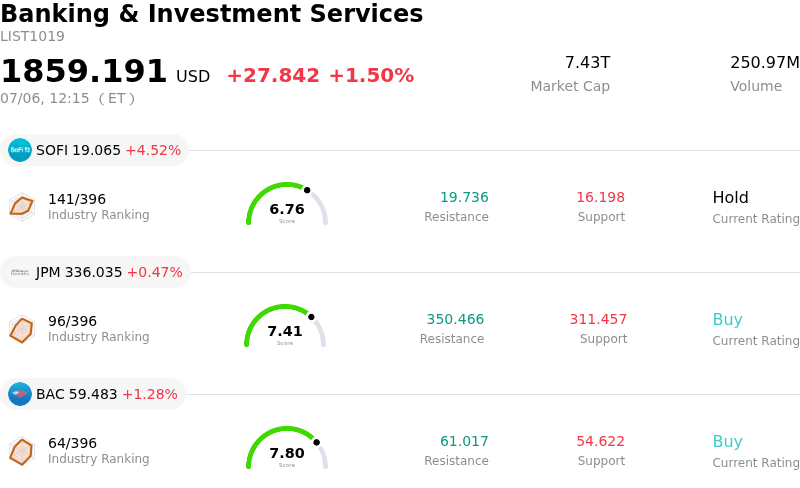
What is driving Morgan Stanley (MS)’s stock price up today?
The upward movement in Morgan Stanley's stock is primarily propelled by building momentum ahead of its second-quarter earnings release on July 15. Analysts have raised their expectations, forecasting a substantial 28% year-over-year surge in earnings per share to $2.73. Investors are increasingly confident that the investment bank will build upon its robust first-quarter momentum, which featured a notable surge in institutional trading and massive asset inflows within its wealth management division.
Furthermore, positive market sentiment has been reinforced by the company's aggressive capital return plans. Following successful Federal Reserve stress test results, Morgan Stanley announced a 15% increase in its quarterly dividend alongside a massive $20 billion multi-year share buyback program, both set to take effect this quarter. This demonstrates strong balance sheet health and provides solid structural support for the stock, offsetting some of the recent valuation downgrades from select sell-side firms.
Simultaneously, Morgan Stanley is executing strategic initiatives to solidify its long-term growth channels. The wealth management unit expanded retail access to its Private Markets and Alternatives platform, PMAX, by lowering minimum investment thresholds and offering daily subscriptions. This move positions the firm to capture a larger share of the fast-growing private credit and private equity markets. This diversification of fee-based revenues, combined with a broader sector rotation back into diversified financials, continues to draw strong institutional interest, driving the current upward trajectory.
Technical Analysis of Morgan Stanley (MS)
Technically, Morgan Stanley (MS) shows a MACD (12,26,9) value of -3.913, indicating a neutral signal. The RSI at 52.462 suggests neutral condition and the Williams %R at 69.642 suggests sell condition. Please monitor closely.
Fundamental Analysis of Morgan Stanley (MS)
Morgan Stanley (MS) is in the Banking & Investment Services industry. Its latest annual revenue is $114.74B, ranking 3 in the industry. The net profit is $16.25B, ranking 2 in the industry. Company Profile
Over the past month, multiple analysts have rated the company as Buy, with an average price target of $207.79, a high of $240.00, and a low of $145.00.
More details about Morgan Stanley (MS)
Company Specific Risks:
- Stretched Valuation Metrics: Following a rapid 22% stock rally to near 52-week highs, Oppenheimer downgraded Morgan Stanley to "Underperform", cautioning that the firm is trading at a premium of approximately 19.4x forward earnings, which leaves a highly compressed risk-reward profile heading into upcoming earnings.
- Asset Concentration and Flow Outflow Risk: While overall wealth management metrics have been robust, Morgan Stanley's total client assets fell from $9.276 trillion at year-end to $9.213 trillion. This downward trend in core assets presents a structural headwind, as the firm’s valuation is heavily dependent on maintaining positive net new asset flows.
- Net Interest Margin Sensitivity to Lower Rates: The firm’s Wealth Management interest rate sensitivity is tilted heavily to the downside; modeling indicates that a 100-basis-point drop in interest rates would slash segment net interest income by $229 million, rendering the bank highly vulnerable to central bank rate cuts.
- Cyclical Capital Markets Exposure: Despite optimism surrounding its underwriting and IPO pipeline, the stock remains highly exposed to cyclical capital markets risk. Analysts warn that any near-term macroeconomic deceleration or stalling in corporate deal-making will disproportionately affect institutional banking revenues and compress profitability margins.
Recommended Articles


