

US Treasury yields climb as markets adjust rate cut expectations

- Gold Price Trend Forecast: Why Did Gold Prices Fall After US CPI Cooled? Fed Chair Speech and Iran Situation Become Obstacles
- Gold Price Trend Forecast: June CPI Plus Fed Chair Congressional Testimony, Can Gold Price Hold Above $4,000?
- TradingKey Daily Market Brief: Gold Falls Below $4,000, TSMC’s Strong Earnings Fail to Stop AI Trade Cooling, Chip Stocks Sold Off
- Gold slides back closer to $4,050 as Iran risks and Fed hike bets boost USD
- Gold Price Forecast: Cooling Inflation Fails to Offset Fed Hawkish Pressure, Gold Price May Fall to $3,500
- Today’s Market Recap: Unexpected PPI Drop Boosts Markets, Apple Hits All-Time High, AI Hardware Stocks Remain Under Pressure, Micron, SanDisk Slump

Mixed US Treasury yields: 10-year note rises to 4.136%, short-term yields dip slightly.
Investor indifference to Richmond Fed data; eyes on upcoming ECB, Fed decisions impacting rate cut views.
Fewer expected Fed rate cuts in 2024; focus on US GDP, Jobless Claims, Core PCE index this week.
US yields advanced on Tuesday, mainly the belly and the long-end of the yield curve, while the three-month bills and the 2-year note were down one basis point, each at 5.21% and 4.383%. At the same time, the US 10-year benchmark note rate is at 4.136%, up almost three basis points, while the 20 and 30-year bond coupons witnessed a rise of four and four and a half basis points, at 4.48% and 4.37%, respectively.
Investors eye central bank’s decisions amid evolving Economic Indicators
In the US, economic data featured the Richmond Fed Composite and Manufacturing Index experienced a decline, moving from -11 to -15 in January. Conversely, the Services Index saw an improvement, rising from 0 to 4.
Although the data was mainly ignored by investors, they had priced out Federal Reserve’s March 2024 rate cut, pushing it back to ward May. Traders should be aware that the European Central Bank (ECB) will review its monetary policy decision on Thursday, ahead of next week’s Federal Reserve decision.
If the ECB remains on keeping rates higher for longer, that could sponson a leg-up in US Treasury yields. Otherwise, a subtle change of tone on major central banks' monetary policy statements could trigger volatility in the markets.
A week ago, investors anticipated the Federal Reserve to implement rate cuts totaling 175 basis points in 2024. However, as of writing, they modified their expectations to 141 basis points of monetary easing, effectively reducing their forecast by one rate cut.
Ahead of the week, the US economic docket will feature the US Gross Domestic Product (GDP) for last year’s Q4, along with Initial Jobless Claims and the Fed’s preferred gauge for inflation, the Core Personal Consumption Expenditure (PCE) price index.
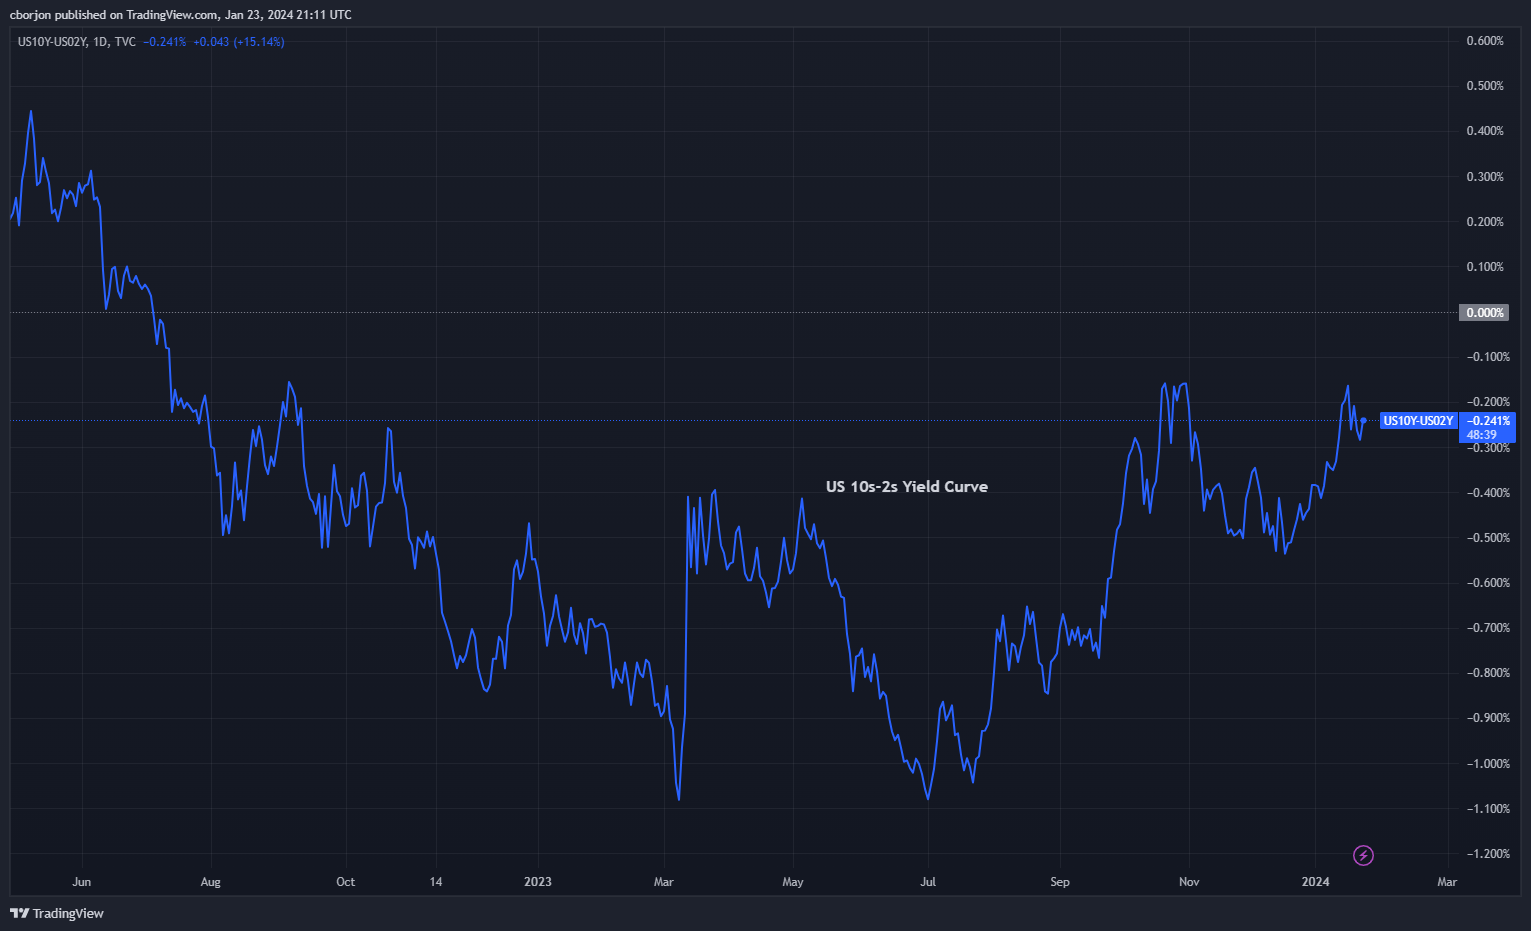
US 10s-2s Spread Chart, Source: TradingView.
Read more
* The content presented above, whether from a third party or not, is considered as general advice only. This article should not be construed as containing investment advice, investment recommendations, an offer of or solicitation for any transactions in financial instruments.


