
US Dollar Index Price Forecast: Tests 98.00 support ahead of US Initial Jobless Claims

- Silver Price Forecast: XAG/USD surges to record high above $56 amid bullish momentum
- Fed Chair Candidate: What Would a Hassett Nomination Mean for U.S. Stocks?
- After the Crypto Crash, Is an Altcoin Season Looming Post-Liquidation?
- The 2026 Fed Consensus Debate: Not Hassett, It’s About Whether Powell Stays or Goes
- U.S. PCE and 'Mini Jobs' Data in Focus as Salesforce (CRM) and Snowflake (SNOW) Report Earnings 【The week ahead】
- AUD/USD holds steady below 0.6550 as traders await Australian GDP release

US Dollar Index may find the primary barrier at the 50-day EMA of 98.54
Short-term price momentum is weaker as DXY remains below the nine-day EMA.
The immediate support appears at the ascending channel’s lower boundary around 97.70.
The US Dollar Index (DXY), which measures the value of the US Dollar (USD) against six major currencies, is extending its losses for the second consecutive day and trading around 98.10 during the early European hours on Thursday. Traders will likely eye the US weekly Initial Jobless Claims due later in the North American session.
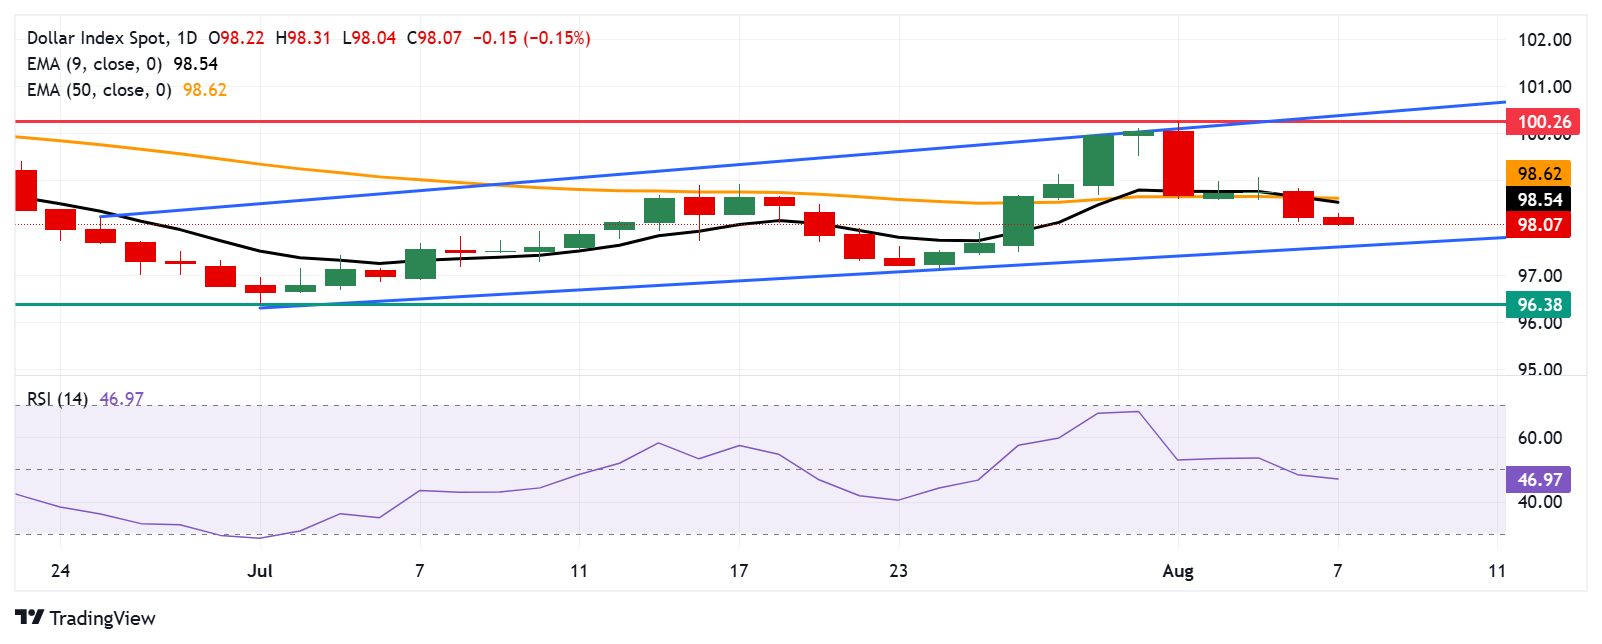
The technical analysis of the daily chart shows the US Dollar Index moving within an ascending channel pattern, suggesting a persistent bullish bias. However, the 14-day Relative Strength Index (RSI) is positioned below the 50 level, weakening bullish bias. The short-term price momentum is also weaker as the DXY remains below the nine-day Exponential Moving Average (EMA).
On the upside, the US Dollar Index may target the initial barrier at the 50-day EMA of 98.54, aligned with the 50-day EMA at 98.62. A successful breach above this level would strengthen the short- and medium-term price momentum and support the DXY to approach the three-month high at 100.26, which was recorded on August 1, followed by the upper boundary of the ascending channel around 100.40.
The DXY tests immediate support at the psychological level of 98.00, followed by the ascending channel’s lower boundary around 97.70. A successful break below the channel would cause the emergence of the bearish bias and put downward pressure on the US Dollar Index to navigate the region around the three-year low at $96.38, recorded on July 1.
US Dollar Index: Daily Chart
Read more
* The content presented above, whether from a third party or not, is considered as general advice only. This article should not be construed as containing investment advice, investment recommendations, an offer of or solicitation for any transactions in financial instruments.


