

GBP/USD Price Forecast: Bullish outlook remains in play near 1.3450

- Bitcoin Returns to $79,000 Level. Prediction Markets Bullish on Breaking $80,000 in April
- Gold holds steady near $4,600 as Fed rate decision looms
- Fed FOMC Meeting Is Approaching: Where Is the Focus? Will There Be More Rate Cuts This Year?
- Goldman Sachs: Structurally Bullish on Gold to $5,400, But Warns of Short-Term Pullback
- Today’s Market Recap: Fed Dissent and AI Capex Surges Define Volatile Earnings Week
- WTI sticks to modest gains above $94.00 as Hormuz standoff fuels supply concerns
GBP/USD trades with mild losses around 1.3450 in Tuesday’s early European session.
Positive view of the pair prevails above the 100-day EMA, but further consolidation looks favorable with neutral RSI indicator.
The immediate resistance level emerges at 1.3585; the first support level to watch is 1.3405.
The GBP/USD pair edges lower to near 1.3450 during the early European session on Tuesday. The potential downside for the major pair might be limited after US President Donald Trump announced he was firing a Federal Reserve (Fed) Governor, Lisa Cook. This, in turn, might raise concerns over the Fed’s independence and undermine the US Dollar (USD) in the near term.
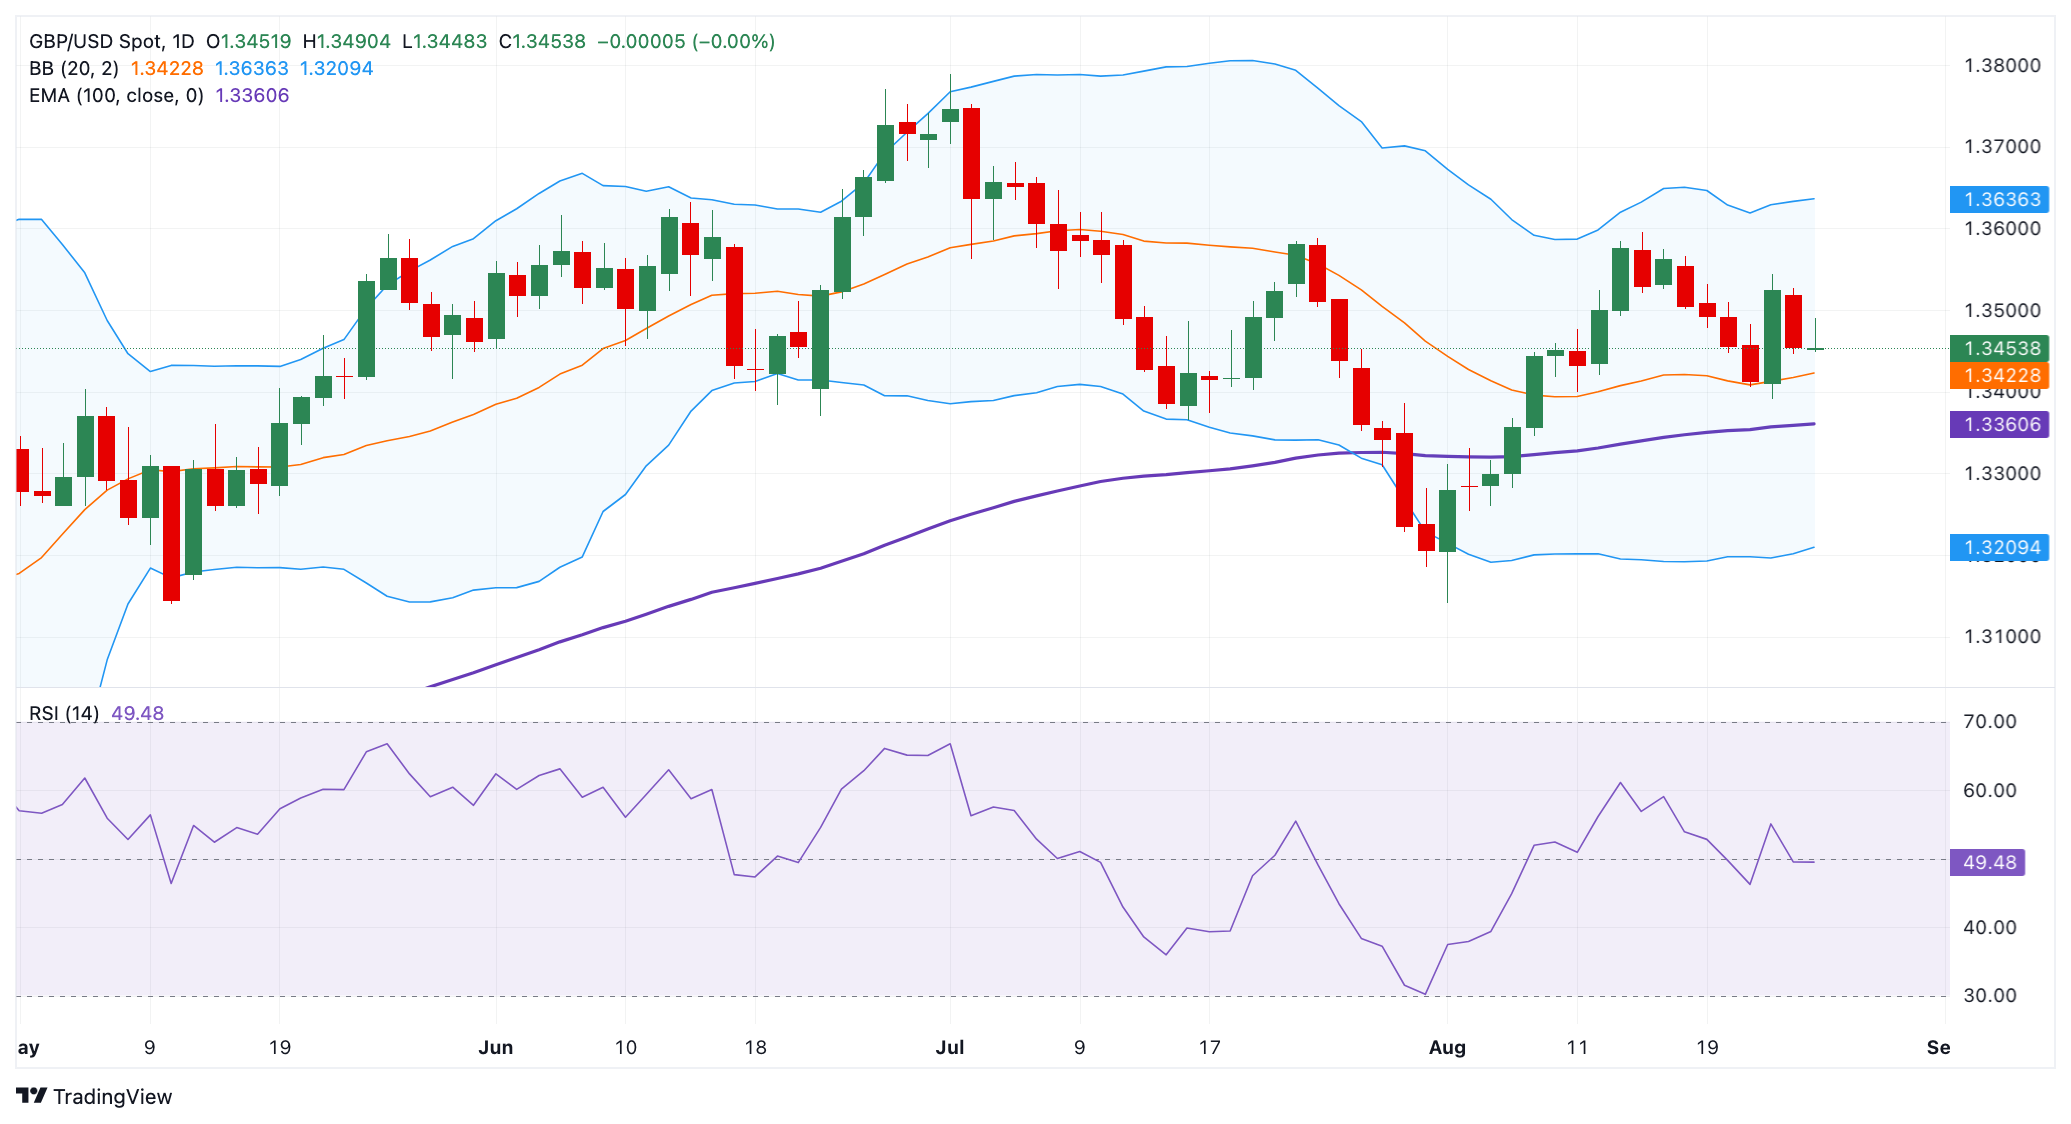
Technically, the constructive outlook of GBP/USD remains in place as the major pair is well-supported above the key 100-day Exponential Moving Average (EMA) on the daily chart. Nonetheless, further consolidation cannot be ruled out, with the 14-day Relative Strength Index (RSI) hovering around the midline. This displays the neutral momentum in the near term.
The first upside barrier emerges at 1.3585, the high of August 13. A decisive break above this level could pick up more momentum and aim for 1.3635, the upper boundary of the Bollinger Band. Further north, the next resistance level is seen at 1.3752, the high of July 2.
On the downside, the low of August 21 at 1.3405 acts as an initial support level for GBP/USD. A breach of this level could drag the major pair toward 1.3360, the 100-day EMA. The crucial contention level to watch is in the 1.3210-1.3200 zone, representing the lower limit of the Bollinger Band and the psychological level.
GBP/USD daily chart
Read more
* The content presented above, whether from a third party or not, is considered as general advice only. This article should not be construed as containing investment advice, investment recommendations, an offer of or solicitation for any transactions in financial instruments.


