


■AUD/USD extends gains, influenced by disappointing S&P Global PMIs from the US, suggesting possible Fed easing.
■US Dollar weakens as Treasury yields fall and equity markets respond positively to the potential shift in Fed policy.
■Upcoming Australian CPI data could influence the Reserve Bank of Australia's policy stance.
The Aussie Dollar recorded back-to-back positive days against the US Dollar and climbed more than 0.59% on Tuesday, as the US April S&P PMIs were weaker than expected. That spurred speculations that the Federal Reserve could put rate cuts back on the table, following last week's hawkish rhetoric. The AUD/USD trades at 0.6488, up by 0.01% as Wednesday’s Asian session begins.
Aussie Dollar capitalizes softer US PMIs amid increasing Fed rate cut hopes
S&P Global revealed that manufacturing activity in the US contracted slightly to 49.9, down from 51.9 in March. The Services and Composite PMIs cling to expansionary territory, but both fell from 51.7 to 50.9 and from 52.1 to 50.9.
Following the data, US equities rose, US Treasury yields fell, and the Greenback posted losses. The US Dollar Index (DXY), which tracks the buck’s performance against the six other currencies, dropped 0.44% and stayed at 105.68.
The AUD/USD rose from daily lows around 0.6440s toward the day’s high at 0.6490.
Other data shows that New Home Sales surged to a six-month high, indicating robust demand in the housing market. However, Building Permits continued to show contraction, albeit with a slight improvement, as the initial decline of -4.3% was revised to -3.7%.
On the Aussie’s front, the Consumer Price Index (CPI) for the first quarter is expected to edge lower, from 4.1% to 3.4% YoY. On a quarterly basis, it is expected to tick higher from 0.6% to 0.8%, while monthly figures are foreseen to remain unchanged at 3.4%.
ANZ analysts commented that the Reserve Bank of Australia wouldn’t likely change their stance, noting, “Looking ahead to the next RBA Board decision on 7 May, we don’t think slightly higher inflation than the RBA is expecting will prompt a shift back to an overt tightening bias.”
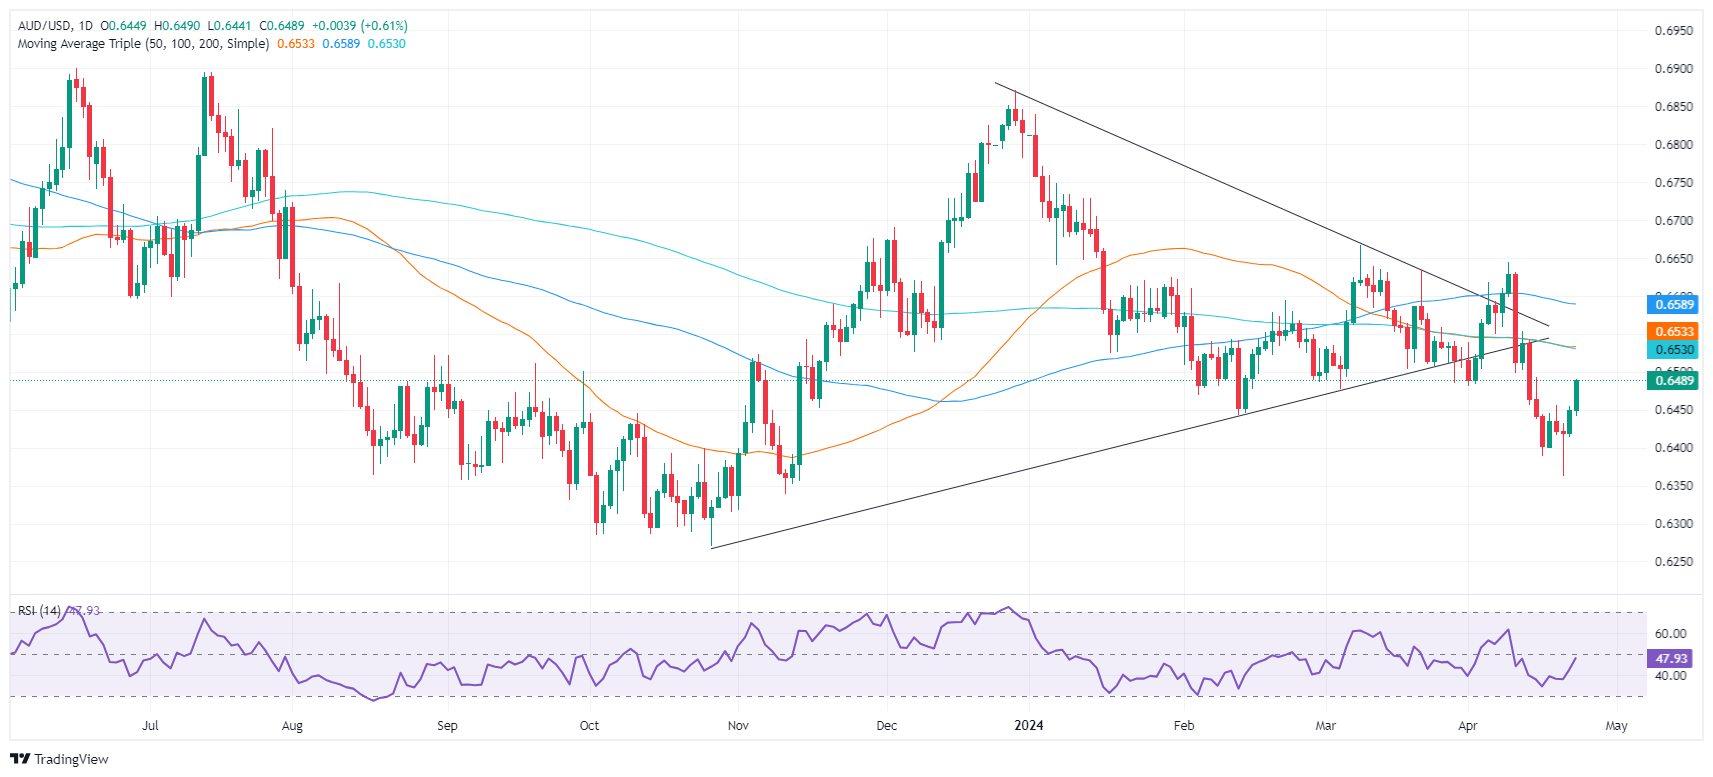
AUD/USD Price Analysis: Technical outlook
From a technical perspective, the AUD/USD turned bullish in the short term, following the formation of a ‘morning star’ chart pattern, but downside risks look. Buyers need to clear the 0.6500 hurdle and surpass the confluence of the 50 and 200-day moving averages (DMAs) at 0.6527/32, which formed a ‘death cross.’ If cleared, that would extend the rally to 0.6600. On the other hand, a reversal and a daily close below 0.6440, could pave the way to re-test year-to-date (YTD) lows of 0.6362.
* The content presented above, whether from a third party or not, is considered as general advice only. This article should not be construed as containing investment advice, investment recommendations, an offer of or solicitation for any transactions in financial instruments.

