

GBP/USD Price Forecast: The bearish outlook remains in play near 1.2900

- Silver Price Forecast: Trump Signals Rapid Progress in US-Iran Negotiations, Bulls Target $90
- Gold declines below $4,500 as Iran tensions stoke inflation fears and bolster Fed hike bets
- Fed’s Powell says credibility lost if President can fire officials
- $1.5 Billion in Crypto Assets Liquidated, Bitcoin Falls Below $66,000 Mark. What Is the Reason?
- Bitcoin Suffers Year’s Strongest Waterfall-Style Decline. Will It Next Drop to the $60,000 Mark?
- WTI rises to near $93.00 as Iran launches missiles toward Kuwait, Bahrain

GBP/USD softens to around 1.2910 in Monday’s early European session.
The negative view of the pair prevails below the 100-day EMA, with the bear RSI indicator.
The initial support level for the pair emerges at 1.2875; the immediate resistance level is located at 1.2983.
The GBP/USD pair weakens to near 1.2910 during the early European session on Monday. The stronger US Dollar (USD) following Donald Trump’s election win continues to undermine the major pair as traders expect the inflationary impulses will keep the US Federal Reserve (Fed) from cutting rates as much as they otherwise would have.
On the other hand, the Bank of England (BoE) reiterated that “a gradual approach to removing policy restraint remains appropriate. Monetary policy will need to continue to remain restrictive for sufficiently long.” Less dovish remarks from the UK central bank could help limit the INR’s losses in the near term.
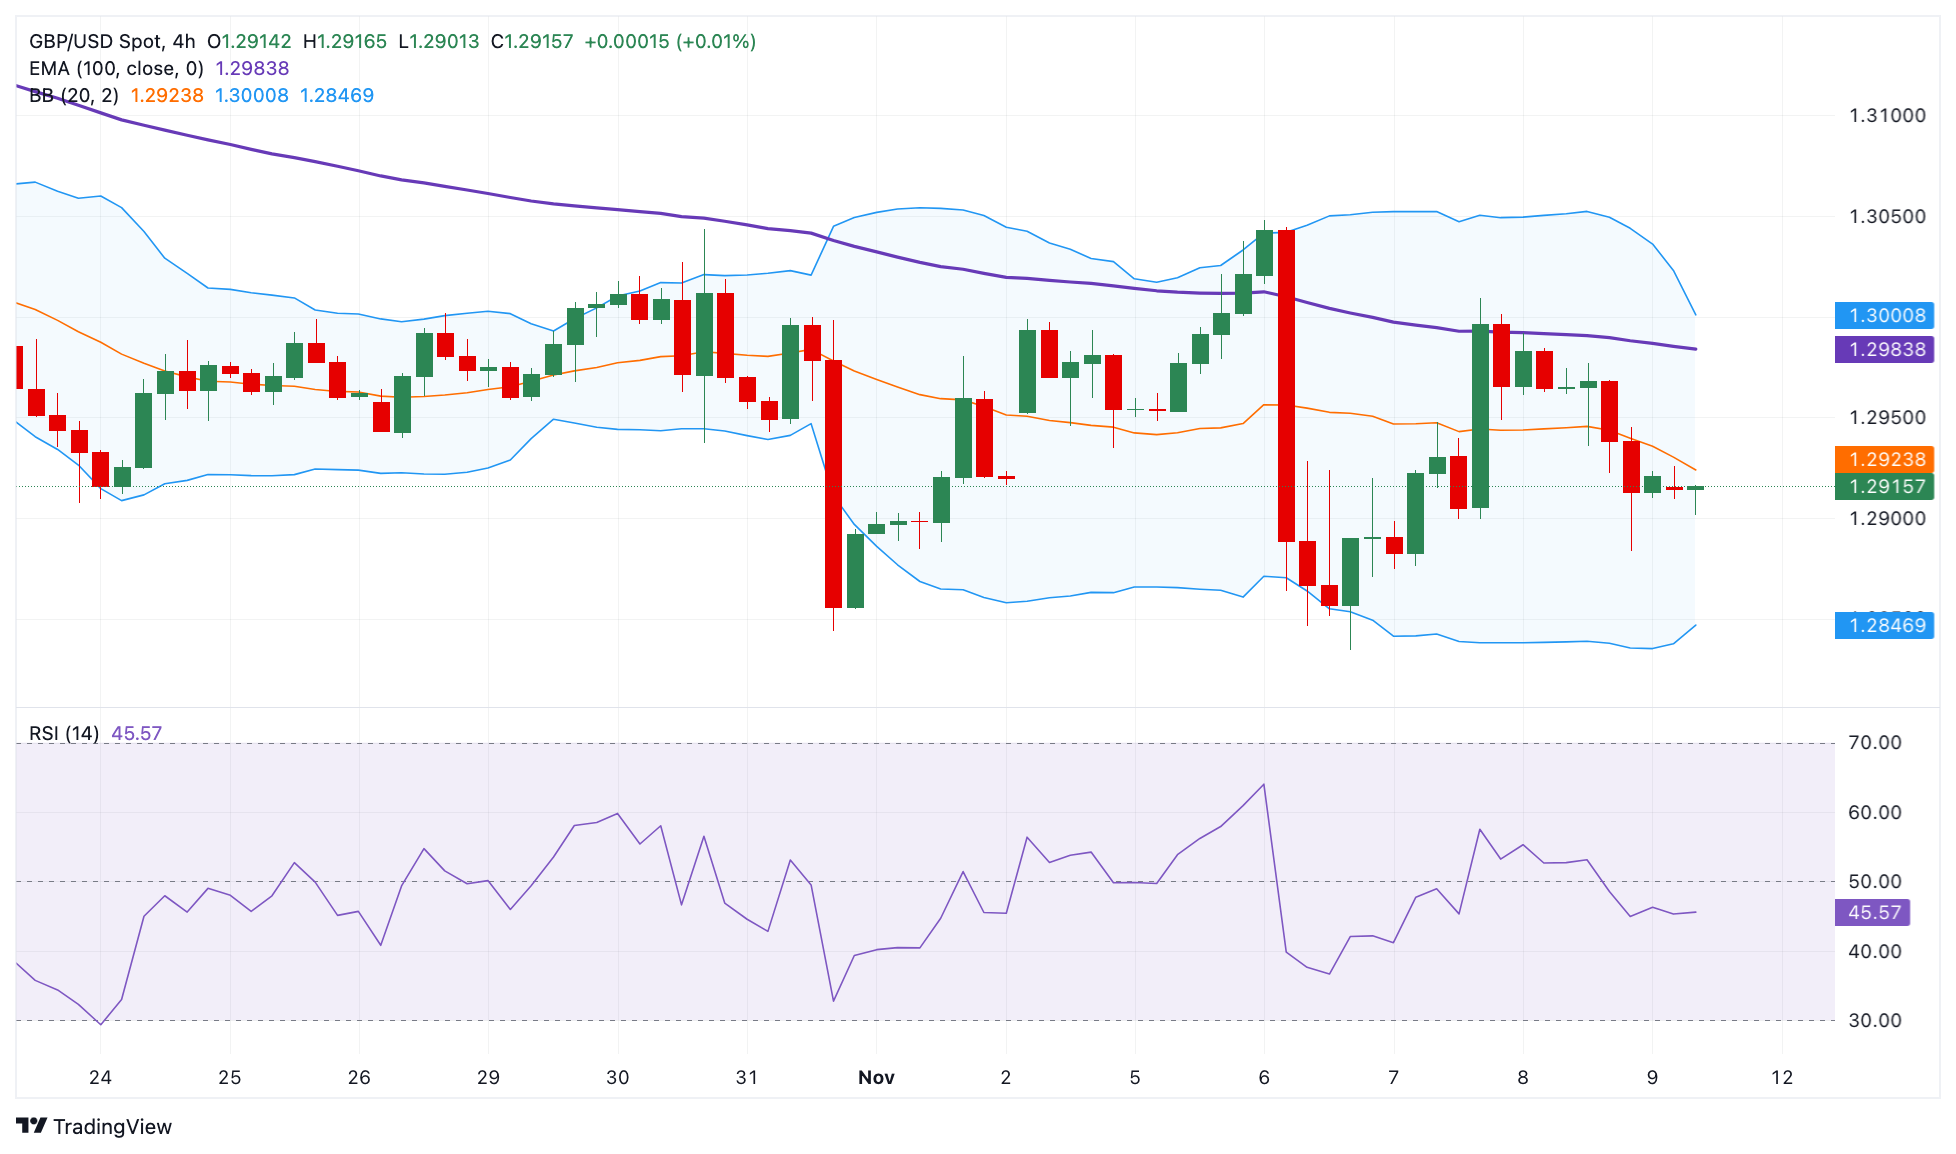
According to the daily chart, GBP/USD keeps the bearish vibe unchanged on the daily timeframe, with the price holding below the key 100-day Exponential Moving Average (EMA). Furthermore, the downward momentum is reinforced by the 14-day Relative Strength Index (RSI), which is located below the midline around 43.85, indicating the path of least resistance is to the downside.
The initial support level for GBP/USD emerges at 1.2875, the low of November 7. Further south, the next contention level is located in the 1.2850-1.2840 zone, representing the lower limit of the Bollinger Band and the low of October 31.
On the bright side, the 100-day EMA at 1.2983 acts as an immediate resistance level for the major pair. The crucial upside barrier is seen at the 1.3000 psychological level. A decisive break above this level could see a rally to 1.3048, the high of November 6.
GBP/USD daily chart
* The content presented above, whether from a third party or not, is considered as general advice only. This article should not be construed as containing investment advice, investment recommendations, an offer of or solicitation for any transactions in financial instruments.


