

AUD/USD pressures as Fed officials hold firm on rate policy


■ AUD/USD falls following hawkish signals from Fed officials, emphasizing no immediate rate cuts.
■ US economic indicators strengthen, with the Philadelphia Fed Manufacturing Index hitting a new high since April 2022.
■ Australian employment data disappoints, with job losses and a slight increase in the unemployment rate casting shadows over RBA forecasts.
The Aussie Dollar is on the defensive against the US Dollar, as Friday’s Asian session commences. On Thursday, the antipodean clocked losses of 0.21% against its counterpart, driven by Fed officials emphasizing they’re in no rush to ease policy. The AUD/USD trades at 0.6419 at the time of writing.
AUD/USD slumped on Fed officials’ comments
A reflection of that was Wall Street’s finishing in the red. On Thursday, Atlanta’s Fed President Raphael Bostic was hawkish, questioning that they could not be able to cut rates towards the end of the year. His colleague, John Williams from the New York Fed, said that the current policy is in a good place and that patience is required before lowering rates. Although he doesn’t consider hiking rates as his base scenario, he added the Fed would raise them if needed.
US data revealed that manufacturing activity is gaining steam. The Philadelphia Fed Manufacturing Index experienced a significant increase, jumping to 15.5, far surpassing the modest expectation of 1.5, its highest level since April 2022. In the jobs market, Initial Jobless Claims for the last week were unchanged at 212K, while Continuing Claims edged up to 1.812 million, below estimates.
Given the solid fundamental backdrop, traders had priced in two rate cuts by the Fed for 2024. Data from the Chicago Board of Trade (CBOT) shows investors project the Federal funds rate (FFR) to end at 5.07%.
On the Aussie front, jobs data declined by 6.6K in March, missing estimates, while the unemployment rate edged up from 3.7% to 3.8%. According to ANZ Analysts, “the labour market may be running slightly hotter than the RBA forecast at the time of its February Statement on Monetary Policy. The RBA was forecasting employment growth to slow to 2.0% y/y and the unemployment rate to reach 4.2% by the end of the June quarter this year.”
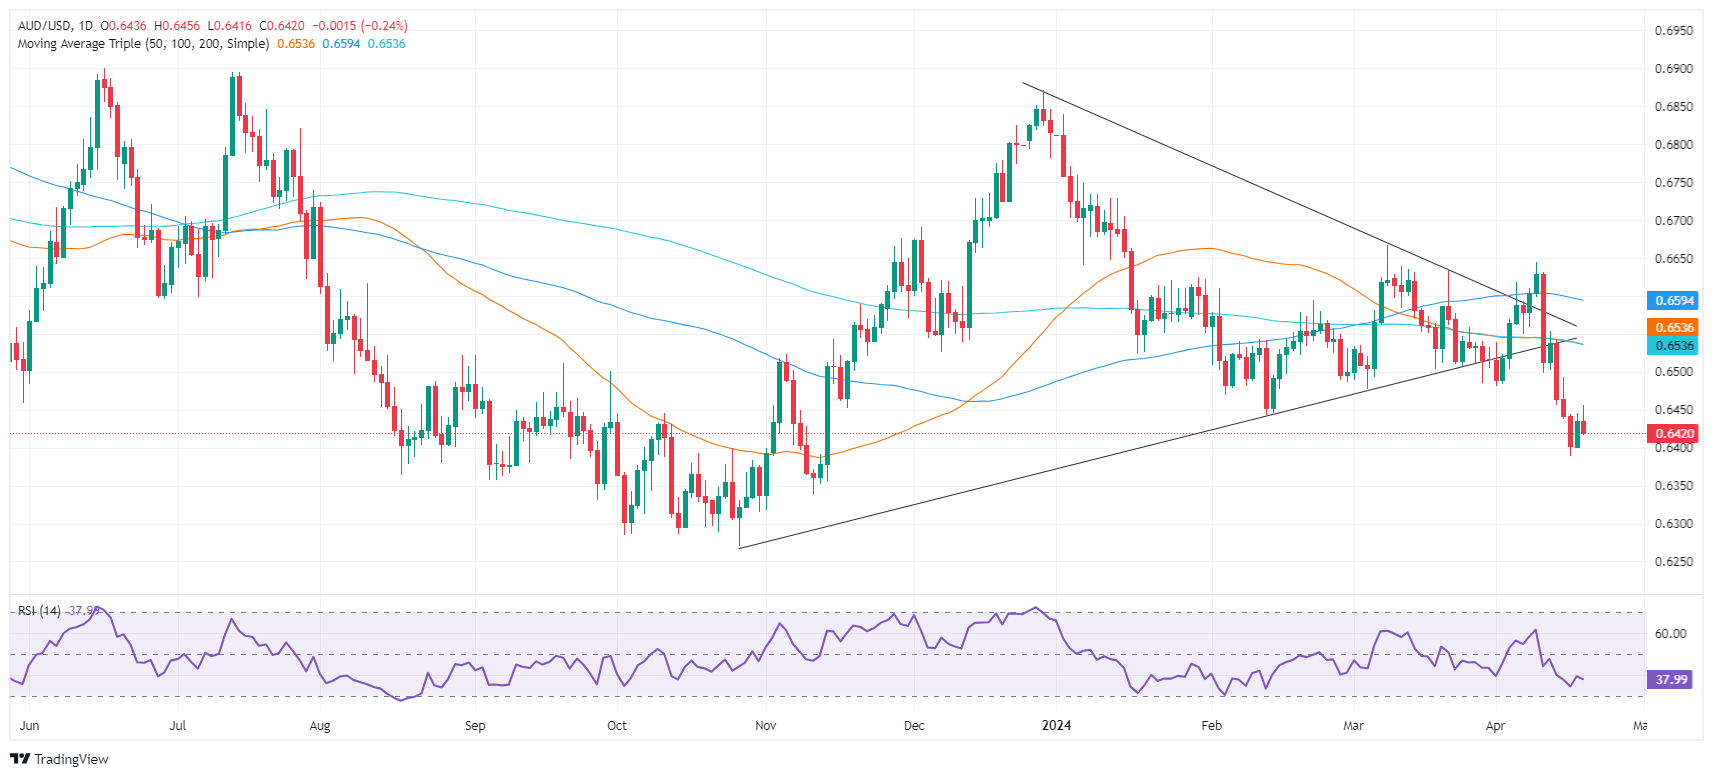
AUD/USD Price Analysis: Technical outlook
The AUD/USD has shifted bearishly after the exchange rate fell below the latest cycle low of 0.6442 on February 13, the previous year-to-date (YTD) low. Hence, a continuation is expected, but sellers must surpass the 0.6400 mark. A breach of the latter will expose the November 10, 2023, daily low of 0.6338 an intermediate support level, followed by a major cycle low printed on October 26, 2023, at 0.6270. On the other hand, buyers need to push prices toward the 0.6500 figure, if they would like to remain hopeful of higher prices.
* The content presented above, whether from a third party or not, is considered as general advice only. This article should not be construed as containing investment advice, investment recommendations, an offer of or solicitation for any transactions in financial instruments.


