Major Asset Performance Review In 2022
- Gold slides below $5,000 amid USD uptick and positive risk tone; downside seems limited
- Gold declines to near $4,850 as low liquidity, easing tensions weigh on demand
- Gold weakens as USD uptick and risk-on mood dominate ahead of FOMC Minutes
- Gold rises above $4,950 as US-Iran tensions boost safe-haven demand
- Gold drifts higher to $5,000 on heightened US-Iran tensions
- Top 3 Price Prediction: Bitcoin, Ethereum, Ripple – BTC, ETH and XRP face downside risk as bears regain control

Global investors experienced a tumultuous year in 2022 as several asset classes remained volatile. This detailed article looks at multiple asset classes and what impacted their performance in the last year.
2022: Asset Performance Market Review
We analyzed 287 different assets across six categories - stocks, bonds, commodities, real estate, currencies, crypto - in 53 countries and regions worldwide. All return data is presented in U.S. dollars to easily compare asset returns in different countries and geographies.
Here are the specific details:
Global stocks: Over 80% of the 123 stock assets recorded declines this year, with an average drop of 11.43%. Energy-related equity assets saw the most significant gains,
Global bonds: Out of the 51 bond assets, only U.S. short-term treasury bonds closed slightly positive. All other bond assets closed lower, with an average decline of -15.72%. Long-term treasury bonds from developed countries saw the largest declines.
Commodities: More than 70% of the commodities analyzed experienced gains with an average return of 11.13%. Natural gas and crude oil saw the highest gains, while copper, cotton, coffee, and other assets declined the most.
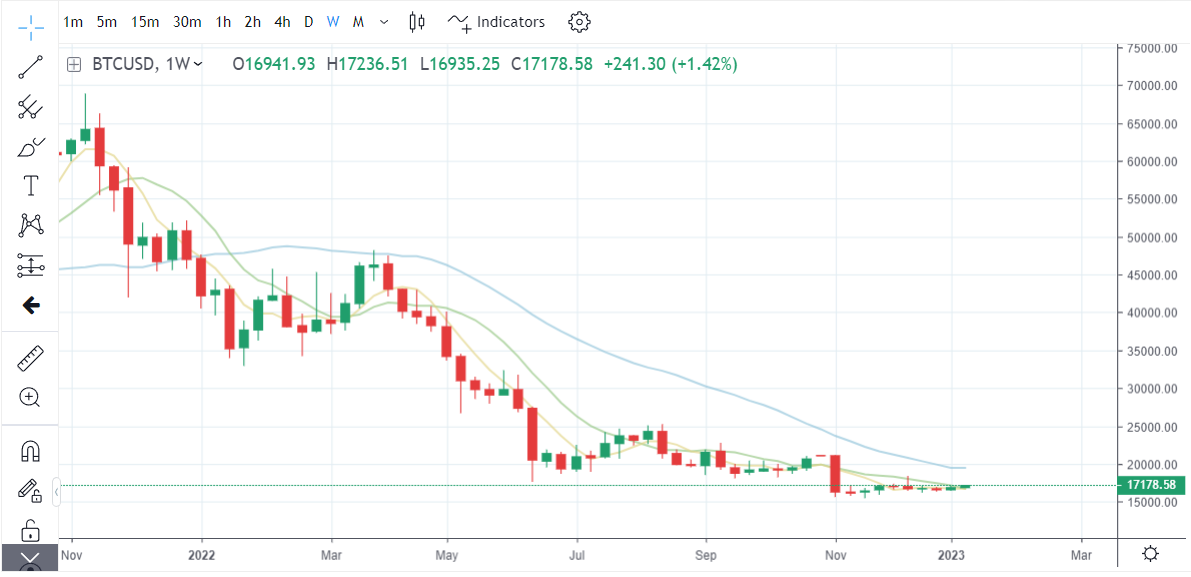
Crypto and bitcoin market: Bitcoin prices fell almost 65% in 2022, which was its worst performance since 2018 when the digital asset fell 73%. The total market cap of cryptocurrencies fell to $798 billion, down from $2.9 trillion in November 2021.
Global Currencies: The U.S. dollar posted its best year in 2022 in seven years on the back of rate hikes and fears of a global slowdown. The USD rose 7.9% annually against a basket of currencies, while the Euro and GBP fell 5.9% and 10.8%, respectively, in 2022.
Global real estate: A rising interest rate environment led to a worldwide decline in real estate prices, with an average fall of 24.8%. European real estate was particularly hard-hit, with Swedish and German real estate falling by more than 50%.
Next, we will analyze the key trends that impacted asset prices and try to estimate how global markets will perform in 2023. Finally, looking at the macroeconomic fundamentals, we may also be able to identify asset class returns with upside potential and those trading at reasonable valuations.
The overall performance of most asset classes was abysmal in 2022, except for a few, such as crude oil and other commodities. Let's see why.
Stock and bond market sell-off
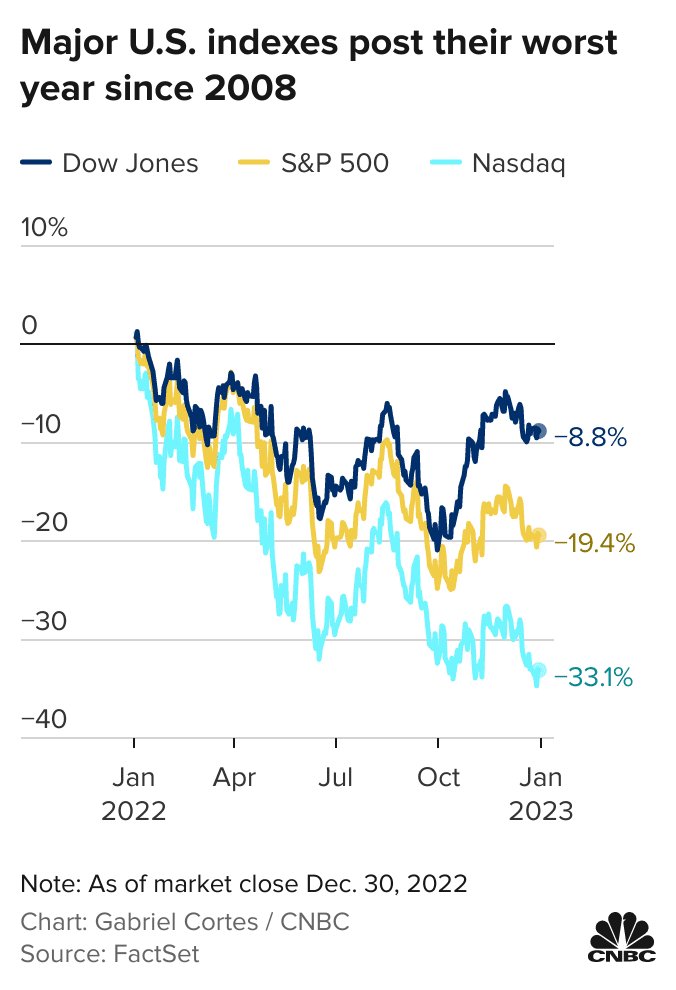
Equity investors lost massive wealth in 2022 as most stock markets, including the United States, Europe, China, and South Korea, experienced significant declines. While the S&P 500 index fell almost 20%, the tech-heavy Nasdaq Composite index declined by 33.1% in 2022.

Historically, the stock market and the bond market have an inverse relationship. For example, during the financial crash of 2008, global equities fell off a cliff, but the bond market performed considerably well. However, in more than four decades, 2022 was the worst year for stocks and bonds as bond prices plummeted on the back of interest rate hikes. But the Chinese bond market was an exception which gained pace in the first ten months of 2022.
Last year, yields on 10-year government bonds in the U.S., Euro Zone, and U.K. saw significant increases, with the yield on U.S. bonds rising from 1.5% to 4.3%, the yield on eurozone bonds rising from -0.2% to 2.55%, and the yield on U.K. bonds rising to 4.3%.
These economies saw their yields rise by 300 basis points, resulting in a drop of approximately 30% in bond prices.
The decline was exacerbated by the fact that bond operations are often leveraged, leading to more considerable declines. Increases in bond yield and price drops led to substantial losses in pension funds and bond investment income for some financial institutions.
Japan, which has a history of zero interest rates, saw its ten-year government bond yield rise from 0.1% to 0.26%. On the other hand, the yield on Chinese government bonds remained relatively stable, fluctuating between 2.8% and 3.0%.
Commodities and crude oil
In 2022, there was a significant differentiation in the performance of commodities. During the first half of the year, both crude oil and agricultural products saw substantial gains, with the price of Brent crude oil rising from $76 per barrel to $125 per barrel by the end of June (with a brief spike to $139 per barrel due to tensions between Russia and Ukraine in March).
However, these gains were primarily undone in the second half of the year as crude oil prices fell to around $80 per barrel.
Agricultural products followed a similar pattern, with prices for corn, soybeans, and wheat rising in the year's first half before falling in the latter half.
Base metals such as copper and aluminum saw sharp declines starting in March and have remained at low levels since then. Nickel experienced a particularly volatile year, with the price of London nickel soaring four times over in just two days in early March before correcting after trading was suspended and resumed.
Finally, due to global inflation, precious metals like gold and silver have seen upward price momentum. Still, this trend has been offset by the increasing interest rates, accelerating the decline in prices.
The U.S. dollar
The U.S. dollar saw a significant appreciation in 2022, as measured by the U.S. dollar index. This index reflects the exchange rate of the U.S. dollar in the international foreign exchange market. It is used to gauge the value of the USD against a basket of currencies, including the euro (which makes up 57.6% of the index), Japanese yen (13.6%), British pound (11.9%), Canadian dollar (9.1%), Swedish krona (4.2%), and Swiss franc (3.6%).
The U.S. dollar index rose from 94 at the beginning of the year to 114 at the end of September, representing a 21% increase, the largest increase since the euro's inception.
This appreciation was partly driven by the decline of currencies that make up the index's weighting, with the euro falling below parity with the U.S. dollar and the yen experiencing a drop of as much as 30% against the USD. The Chinese yuan saw its most significant depreciation against the U.S. dollar since 2005, falling from 6.3 to 7.3 last year.
Bitcoin and other digital currencies crash
Digital currencies, including Bitcoin, have seen incredible growth in recent years, with BTC prices rising from a low of $4,000 in 2020 to over $69,000 in late 2021.
However, in 2022, digital currencies saw a significant decline, with Bitcoin falling from $55,000 to $15,000 in 2022, resulting in a 75% fall from all-time highs for BTC.

(source: mitrade)
The worldwide shift towards risk-off assets in 2022 contributed to the fall of Bitcoin and other cryptocurrencies. But big-ticket collapses in the digital market space, such as Terra, FTX, Celsius, and Three Arrows Capital, drove the sell-off through 2022.
Why most asset classes underperformed in 2022?
In 2022, the performance of various assets was influenced mainly by the rise in global interest rates driven by U.S. inflation. The increase in interest rates led to a plunge in the global bond market, resulting in a sharp rise in bond yields.
The rapid increase in U.S. bond yields led to a fall in the valuation of global risk assets and a sharp drop in the equity market. But on the other hand, it caused a sharp appreciation of the USD and a corresponding sharp depreciation of non-U.S. dollar currencies.
What should investors expect in 2023?
Looking ahead to 2023, the global macro environment is expected to undergo significant changes. For example, the U.S. economy may enter a recessionary phase, while China's economy is expected to see a strong recovery following modifications to its epidemic prevention policies.
Additionally, monetary policy easing may be limited after successive cuts to the reserve requirement ratio and interest rates, which will significantly impact asset price trends in the coming year.
Global inflation is expected to remain high as commodity prices ranging from food to fossil fuels might gain pace. Further, a strong labor market and wage hikes will contribute to inflation. If central banks cannot tame inflation, global interest rates will remain elevated pressurizing equities and digital assets around the world. |
Read more
* The content presented above, whether from a third party or not, is considered as general advice only. This article should not be construed as containing investment advice, investment recommendations, an offer of or solicitation for any transactions in financial instruments.


