
Top 3 Price Prediction: BTC and XRP hover near key supports while ETH consolidates after record highs

- Gold Price Forecast: XAU/USD tumbles to near $3,950 on Fed's hawkish comments, trade optimism
- Gold holds gains near $3,950 ahead of Trump-Xi meeting
- Bitcoin, cryptos fail to rally as Fed Chair sparks cautious sentiment
- Bitcoin Stalls Below $110,000 as Miners Step In to Sell
- Crypto Bulls Cheer as Fed Pivot Hopes Rise and Quantitative Tightening Nears Its End
- Forex Today: US Dollar clings to weekly gains as central bank dust settles

Bitcoin trades in the red on Monday after facing rejection from its previously broken trendline.
Ethereum price consolidates around $4,712 after printing a new all-time high of $4,956 on Sunday.
Ripple’s XRP nears key support at $2.99; a daily close below could trigger an extended correction toward $2.72.
Bitcoin (BTC), Ethereum (ETH), and Ripple (XRP) start this week on a cautious note as traders eye critical levels. BTC and XRP are holding support around key zones, while ETH consolidates just below record highs, leaving the market at a potential turning point.
Bitcoin faces rejection from trendline pullback resistance
Bitcoin price found support around the 100-day Exponential Moving Average (EMA) at $110,865 on Friday and rallied 3.94%. However, it found rejection from its previously broken trendline the next day and declined 3.42% until Sunday. At the time of writing on Monday, it trades slightly down at around $112,852.
If BTC closes below the 100-day EMA at $110,865 on a daily basis, it could extend the decline toward its next support level at $103,701, its 200-day EMA.
The Relative Strength Index (RSI) on the daily chart reads 43 after facing rejection from its neutral level of 50 on Friday, indicating bearish momentum. The Moving Average Convergence Divergence (MACD) also showed a bearish crossover last week and supports the bearish thesis.
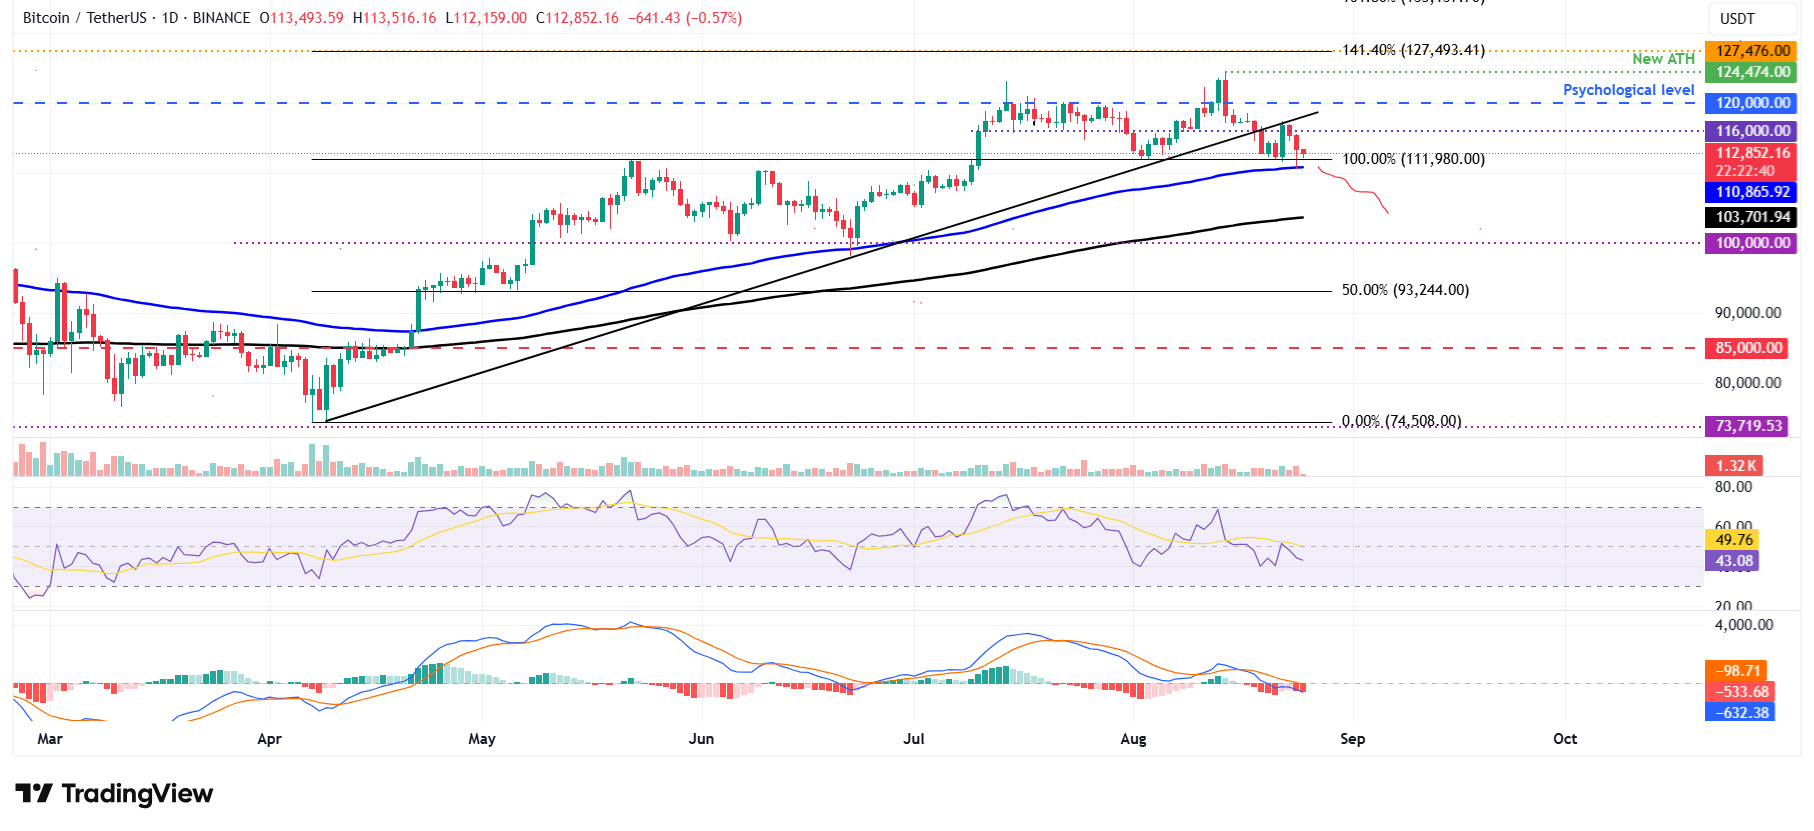
BTC/USDT daily chart
However, if BTC finds support around the 100-day EMA at $110,865 and recovers, it could extend the rally toward its key resistance at $116,000.
Ethereum consolidates after a record high of $4,956
Ethereum price found support around the daily level of $4,232 on Thursday and rallied 14.36% the next day. ETH price extended the gains, reaching a new all-time high of $4,956 on Sunday. At the time of writing on Monday, it hovers around $4,747.
If ETH continues its upward trend, it could extend the gains to set a record high above $5,000.
The RSI on the daily chart reads 64, above the neutral level of 50, indicating strong bullish momentum. Moreover, the MACD indicator also showed a bullish crossover on Saturday, further supporting the bullish thesis.
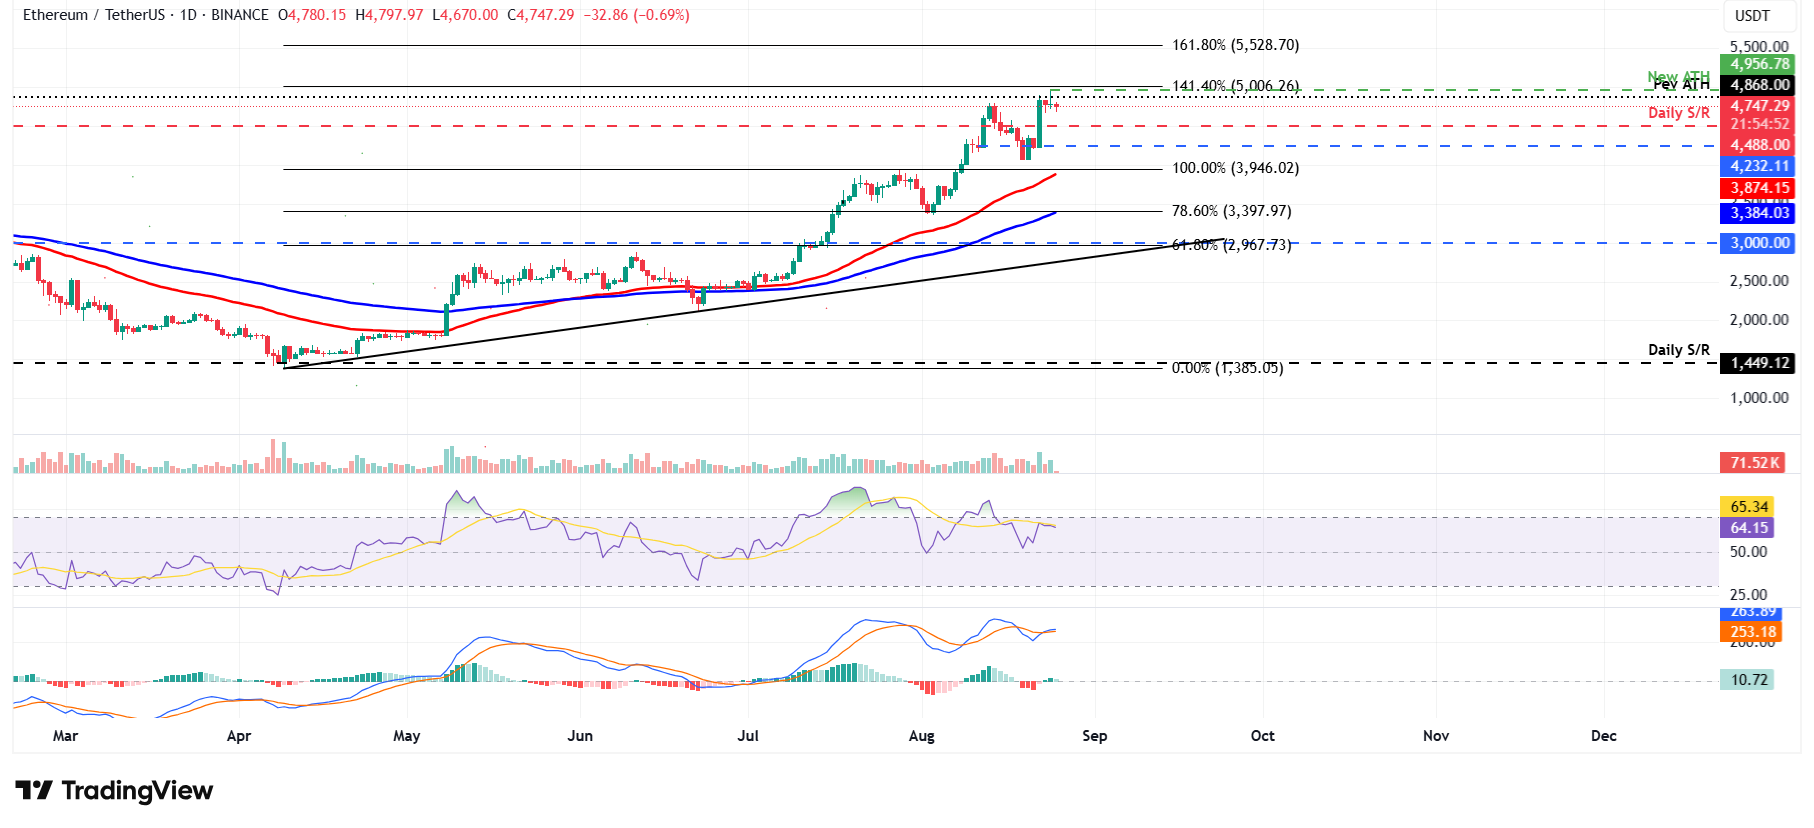
ETH/USDT daily chart
On the other hand, if ETH faces a pullback, it could extend the correction toward its daily level at $4,488.
XRP nears key support zone
XRP price found support around its 50% retracement level at $2.78 on Friday and rallied 7.80%, closing above its 61.8% Fibonacci retracement level at $2.99. XRP faced a slight decline in the next two days, finding support around the $2.99 level. At the time of writing on Monday, it is near this support zone.
If XRP finds support around the $2.99 level and recovers, it could extend the rally toward its next daily resistance at $3.40.
The RSI on the daily chart hovers around the neutral level of 50, indicating indecisiveness among traders. The MACD lines are also converging, supporting the indecisiveness thesis.
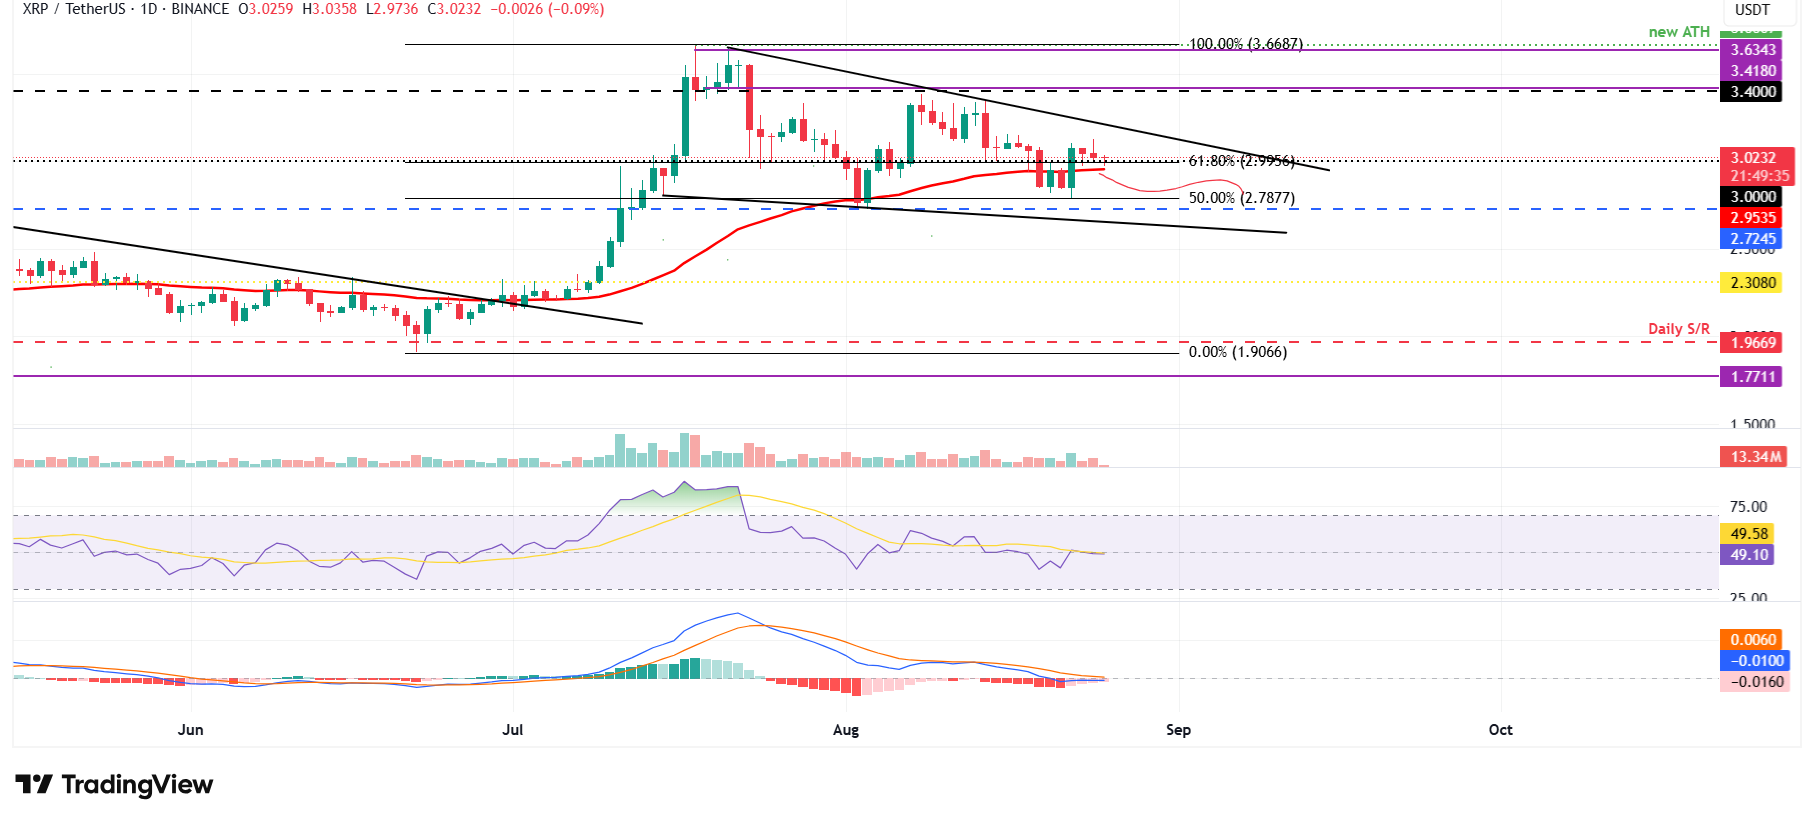
XRP/USDT daily chart
Conversely, if XRP closes below its $2.99 support, it could extend the decline toward its next support at $2.78.
Read more
* The content presented above, whether from a third party or not, is considered as general advice only. This article should not be construed as containing investment advice, investment recommendations, an offer of or solicitation for any transactions in financial instruments.


