


USD/CAD rebounds to around 1.3595 in Thursday’s early European session.
The pair keeps the negative outlook below the 100-day EMA with a bearish RSI indicator.
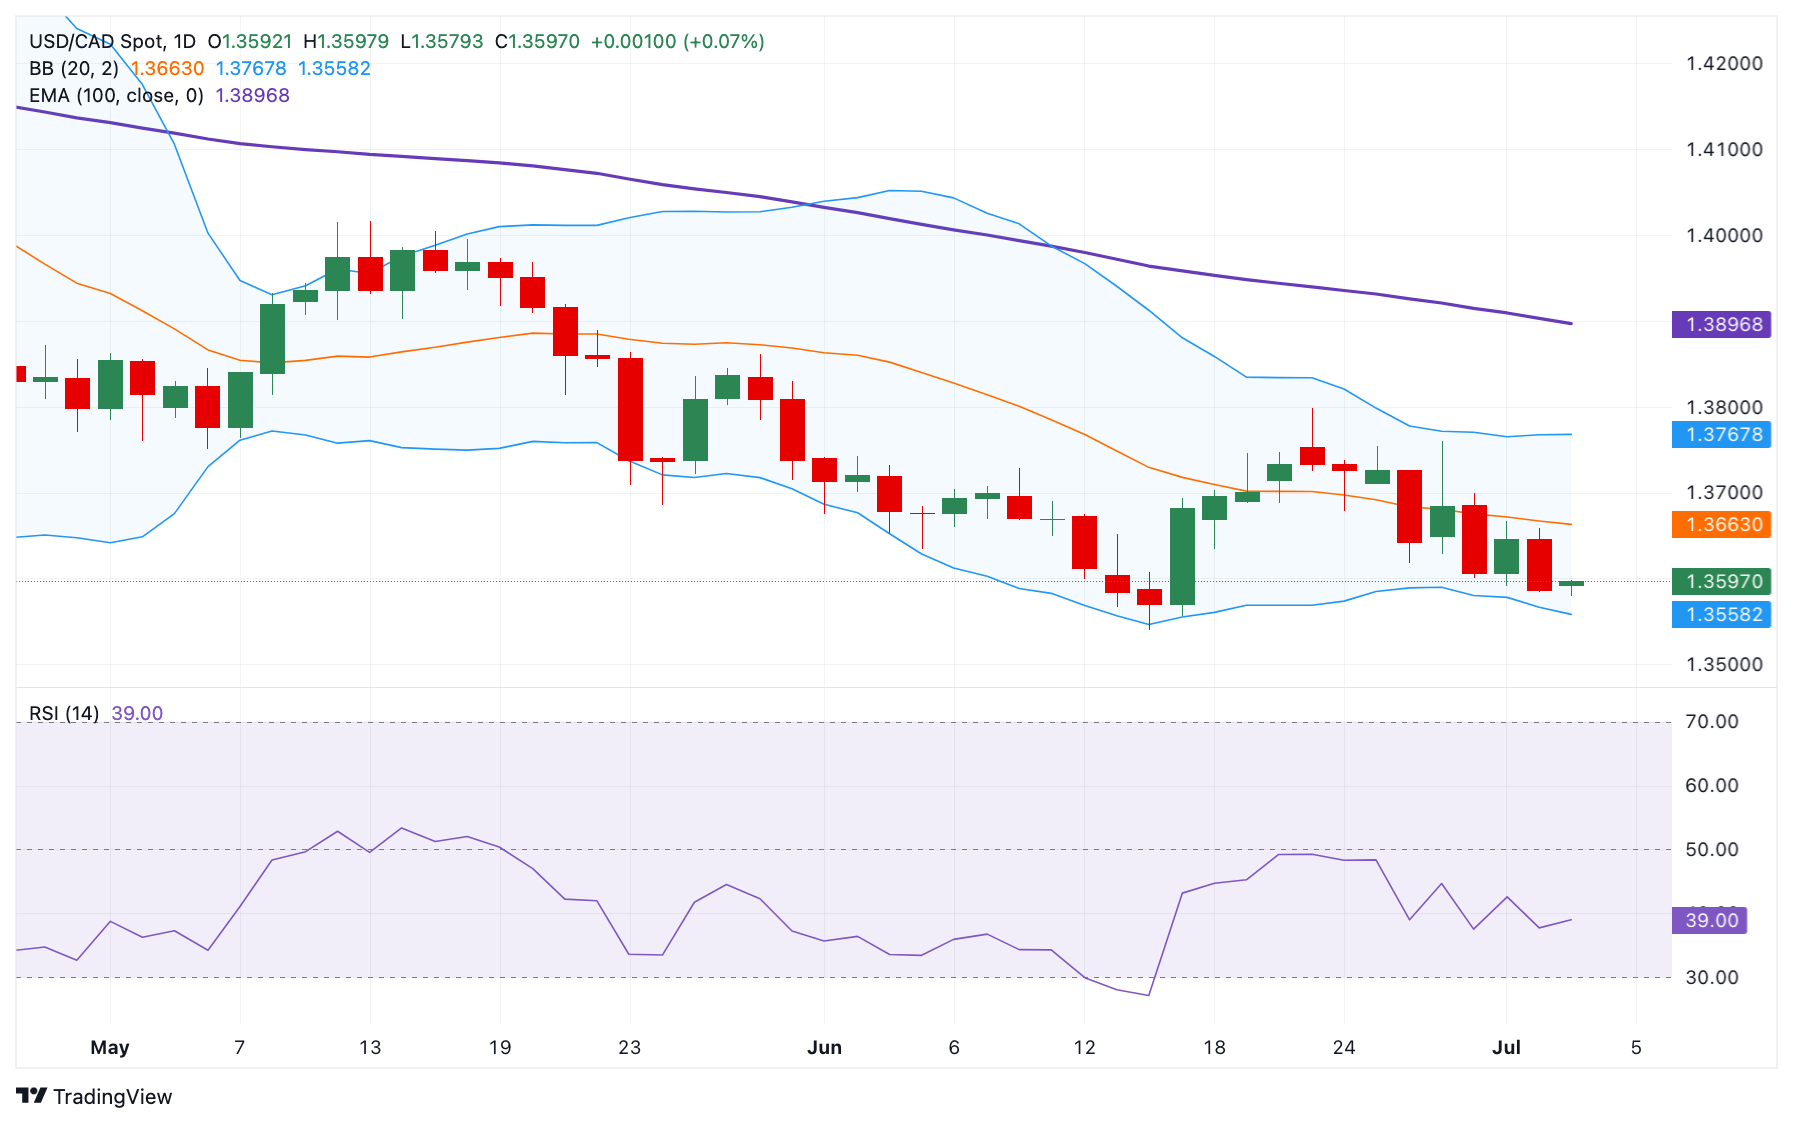
The initial support emerges at 1.3555; the first upside barrier is located at 1.3700.
The USD/CAD pair recovers some lost ground to near 1.3595 during the early European session on Thursday. The potential upside for the pair might be limited as weaker AUS ADP employment numbers supported market expectations of a Federal Reserve (Fed) interest rate cut. The attention will shift to the US Nonfarm Payrolls (NFP) report for June, which will be published later on Thursday.
According to the daily chart, the bearish outlook of USD/CAD remains in play as the pair remains capped below the key 100-day Exponential Moving Average (EMA). The path of least resistance is to the downside, with the 14-day Relative Strength Index standing below the midline near 38.75.
The first downside target for the pair emerges at 1.3555, the lower limit of the Bollinger Band. Extended losses could see a drop to the 1.3505-1.3500 zone, the low of September 5, 2024, and the round mark. The next contention level for USD/CAD is seen at 1.3430, the low of September 24, 2024.
On the bright side, the immediate resistance level is located at the 1.3700 psychological level. Sustained trading above this level could attract some buyers to 1.3767, the upper boundary of the Bollinger Band. Further north, the next hurdle to watch is 1.3895, the 100-day EMA.
USD/CAD Daily Chart
* The content presented above, whether from a third party or not, is considered as general advice only. This article should not be construed as containing investment advice, investment recommendations, an offer of or solicitation for any transactions in financial instruments.


