

USD/CAD Price Forecast: The first upside barrier emerges above 1.4400

- Silver Price Forecast: Trump Signals Rapid Progress in US-Iran Negotiations, Bulls Target $90
- Gold declines below $4,500 as Iran tensions stoke inflation fears and bolster Fed hike bets
- Fed’s Powell says credibility lost if President can fire officials
- $1.5 Billion in Crypto Assets Liquidated, Bitcoin Falls Below $66,000 Mark. What Is the Reason?
- Bitcoin Suffers Year’s Strongest Waterfall-Style Decline. Will It Next Drop to the $60,000 Mark?
- WTI rises to near $93.00 as Iran launches missiles toward Kuwait, Bahrain

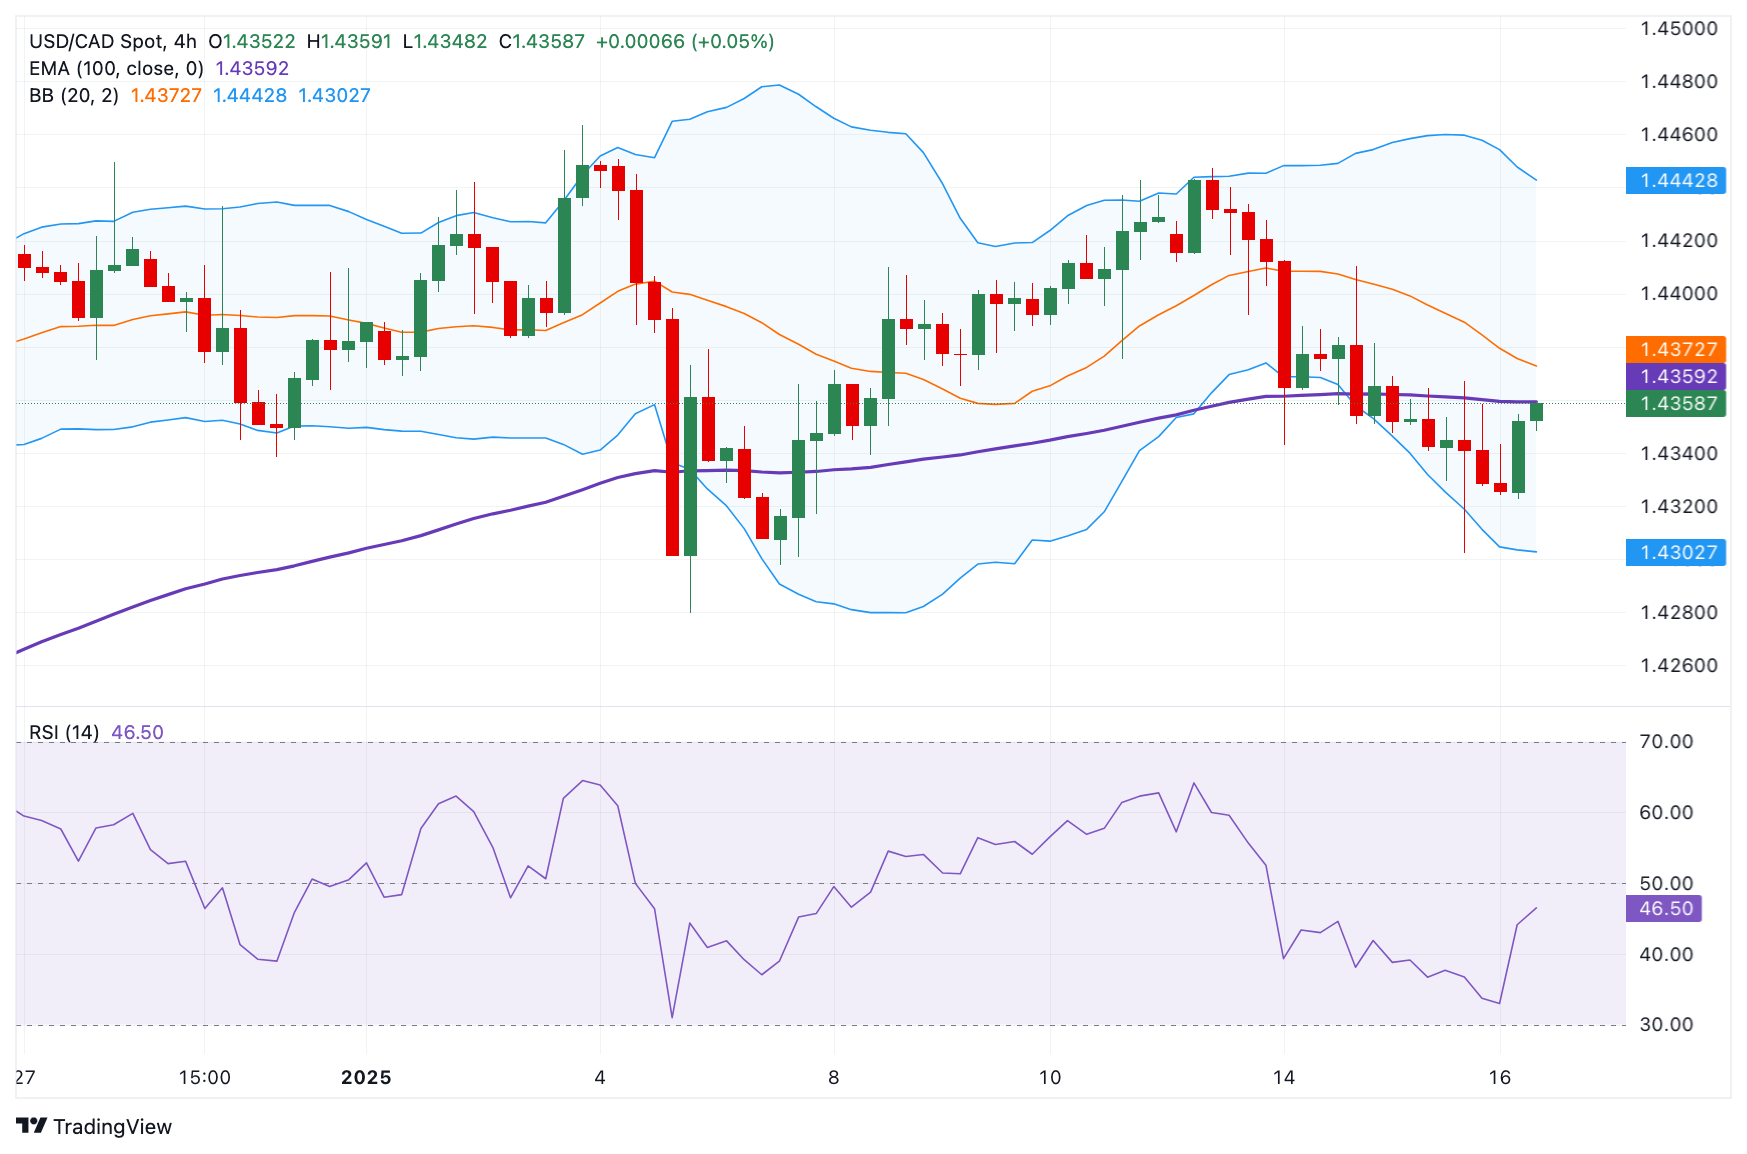
USD/CAD rebounds to around 1.4355 in Thursday’s early European session.
The negative outlook prevails below the 100-period EMA with the bearish RSI indicator.
The initial support level is located at 1.4322; the first upside barrier emerges at the 1.4400-1.4410 region.
The USD/CAD pair recovers to 1.4355, snapping the three-day losing streak during the early European session on Thursday. The renewed US Dollar (USD) demand provides some support to the pair. However, a rise in crude oil prices might boost the commodity-linked Loonie and cap the upside for the pair.
According to the 4-hour chart, the bearish outlook of USD/CAD remains intact as the pair is below the key 100-period Exponential Moving Average (EMA). If the pair decisively crosses above this level, it could resume its upside. However, the Relative Strength Index (RSI) stands below the midline near 45.80, suggesting that further downside cannot be ruled out in the near term.
The initial support level for USD/CAD is located at 1.4322, the low of January 16. Extended losses could expose 1.4300, representing the lower limit of the Bollinger Band and psychological level. The additional downside filter to watch is 1.4279, the low of January 6.
On the other hand, sustained trading above the key 100-period EMA could see a rally to the 1.4400-1.4410 zone, the round mark and the high of January 14. Further north, the next hurdle to watch is 1.4442, the upper boundary of the Bollinger Band.
USD/CAD 4-hour chart
* The content presented above, whether from a third party or not, is considered as general advice only. This article should not be construed as containing investment advice, investment recommendations, an offer of or solicitation for any transactions in financial instruments.


