

NZD/USD Price Forecast: Falls toward 0.5700 as medium-term price momentum weakens

- Gold Price Forecast: Gold Poised to Break $4,200 as Oil Price Slump Eases Inflation Fears
- Gold Price Forecast: Oil Price Breaking $100 Fuels Inflation Concerns, Will Gold Prices Fall Further?
- Middle East War updates: US-Iran pause strikes as Trump weighs up diplomatic options
- WTI climbs above $87.00 as Middle East conflict threatens key choke points
- Today’s Market Recap: Oil Breaks $100, Fueling Inflation Fears, as AI Capex Faces Scrutiny and Tesla’s 14% Plunge Drags Down Tech Sector
- WTI Crude Breaks $90, Brent Crude Approaches $100, Middle East Shipping Risks Drive Continuous Rise in Oil Prices

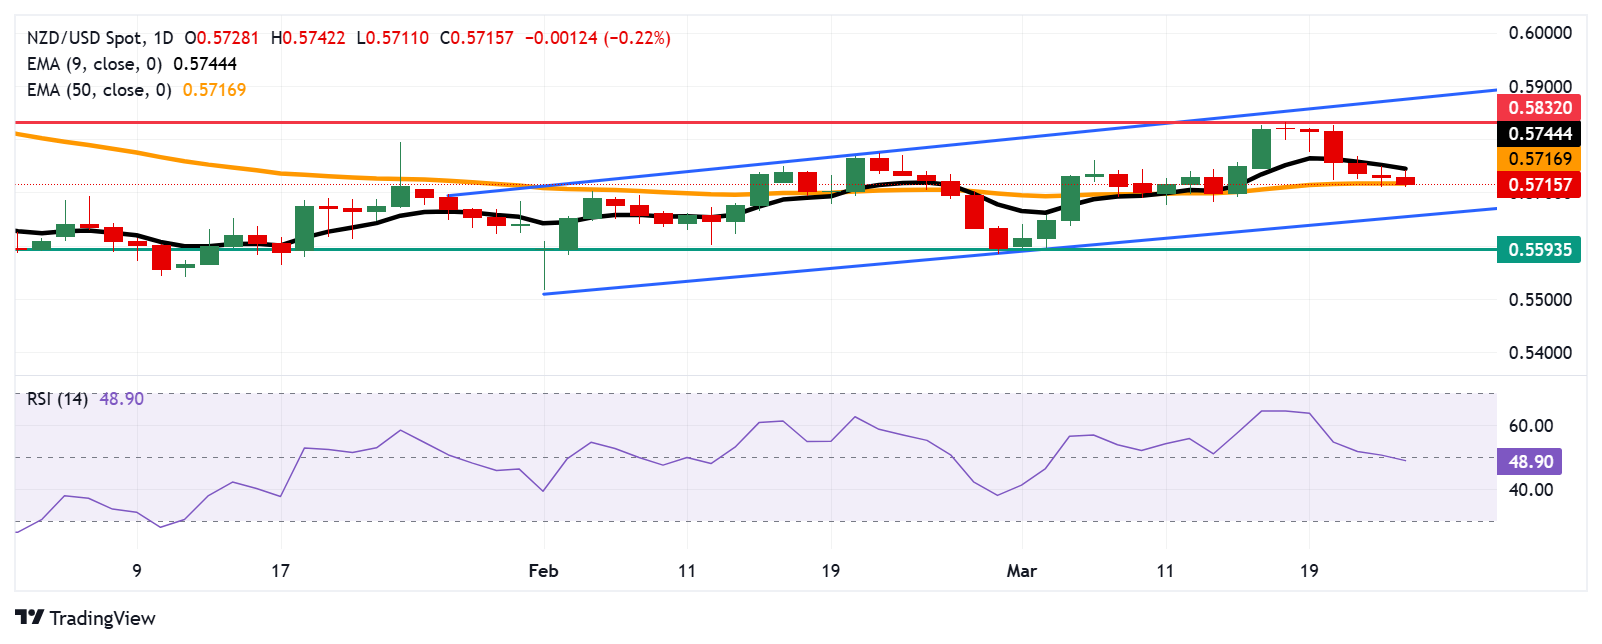
NZD/USD could test the psychological support at the 0.5700 level
The daily chart indicates a prevailing bullish bias, though the 14-day RSI dropping below 50 suggests a possible bearish shift.
A rebound above the 50-day EMA could revive medium-term momentum, paving the way for testing the nine-day EMA at 0.5744.
NZD/USD continues its losing streak that began on March 18, trading around 0.5710 during European hours on Tuesday. The daily chart's technical analysis reflects a prevailing bullish bias, with the pair remaining within an ascending channel pattern. However, the 14-day Relative Strength Index (RSI) dipping below 50 signals a potential bearish shift.
Additionally, NZD/USD's decline below the nine- and 50-day Exponential Moving Averages (EMAs) suggests short- to medium-term weakness, indicating a transient loss of momentum. Despite this, the nine-day EMA staying above the 50-day EMA reinforces the broader bullish trend, pointing to an ongoing recovery.
The clear break below the 50-day EMA has dampened medium-term momentum, increasing downward pressure on the NZD/USD pair to test the psychological support at the 0.5700 level, followed by the lower boundary of the ascending channel around the 0.5660 level. A breakdown below this channel could strengthen the bearish bias, potentially driving the pair toward the monthly low of 0.5593, recorded on March 3.
On the upside, a rebound above the 50-day EMA at 0.5716 could restore medium-term momentum, allowing the NZD/USD pair to test the nine-day EMA at 0.5744. A breakout above this level may strengthen short-term momentum, pushing the pair toward the three-month high of 0.5832, reached on March 18. Further resistance lies near the upper boundary of the ascending channel at approximately 0.5880.
NZD/USD: Daily Chart
New Zealand Dollar PRICE Today
The table below shows the percentage change of New Zealand Dollar (NZD) against listed major currencies today. New Zealand Dollar was the weakest against the Japanese Yen.

The heat map shows percentage changes of major currencies against each other. The base currency is picked from the left column, while the quote currency is picked from the top row. For example, if you pick the New Zealand Dollar from the left column and move along the horizontal line to the US Dollar, the percentage change displayed in the box will represent NZD (base)/USD (quote).
Read more
* The content presented above, whether from a third party or not, is considered as general advice only. This article should not be construed as containing investment advice, investment recommendations, an offer of or solicitation for any transactions in financial instruments.


