

How High Can XRP Price Go After The Ripple Victory?

Mitrade
coverImg
Source: DepositPhotos

After more than four years, the US Securities and Exchange Commission is discontinuing its proceedings against Ripple in the XRP lawsuit. The announcement by CEO Brad Garlinghouse on X—stating “This is it – the moment we’ve been waiting for. The SEC will drop its appeal – a resounding victory for Ripple, for crypto, every way you look at it. The future is bright. Let’s build”—has generated waves of optimism among XRP supporters.


Although attorney Jeremy Hogan noted that Ripple can still take a range of actions, the consensus among market participants is that this development dispels a massive victory for Ripple. Hogan remarked that it is still unclear if Ripple agrees to drop the appeal. He added that there are 4 possibilities left:


a. Ripple continues its appeal, and we get a ruling from an appellate court on whether investment contracts require contracts, etc..b. Ripple agrees to drop its appeal, jurisdiction returns to the trial court, and the parties attempt to amend the judgment.c. Ripple agrees to drop its appeal, and the parties enter into an agreement between them without trying to amend the judgment.d. Ripple just pays the $125mil and moves on.


How High Can XRP Go?


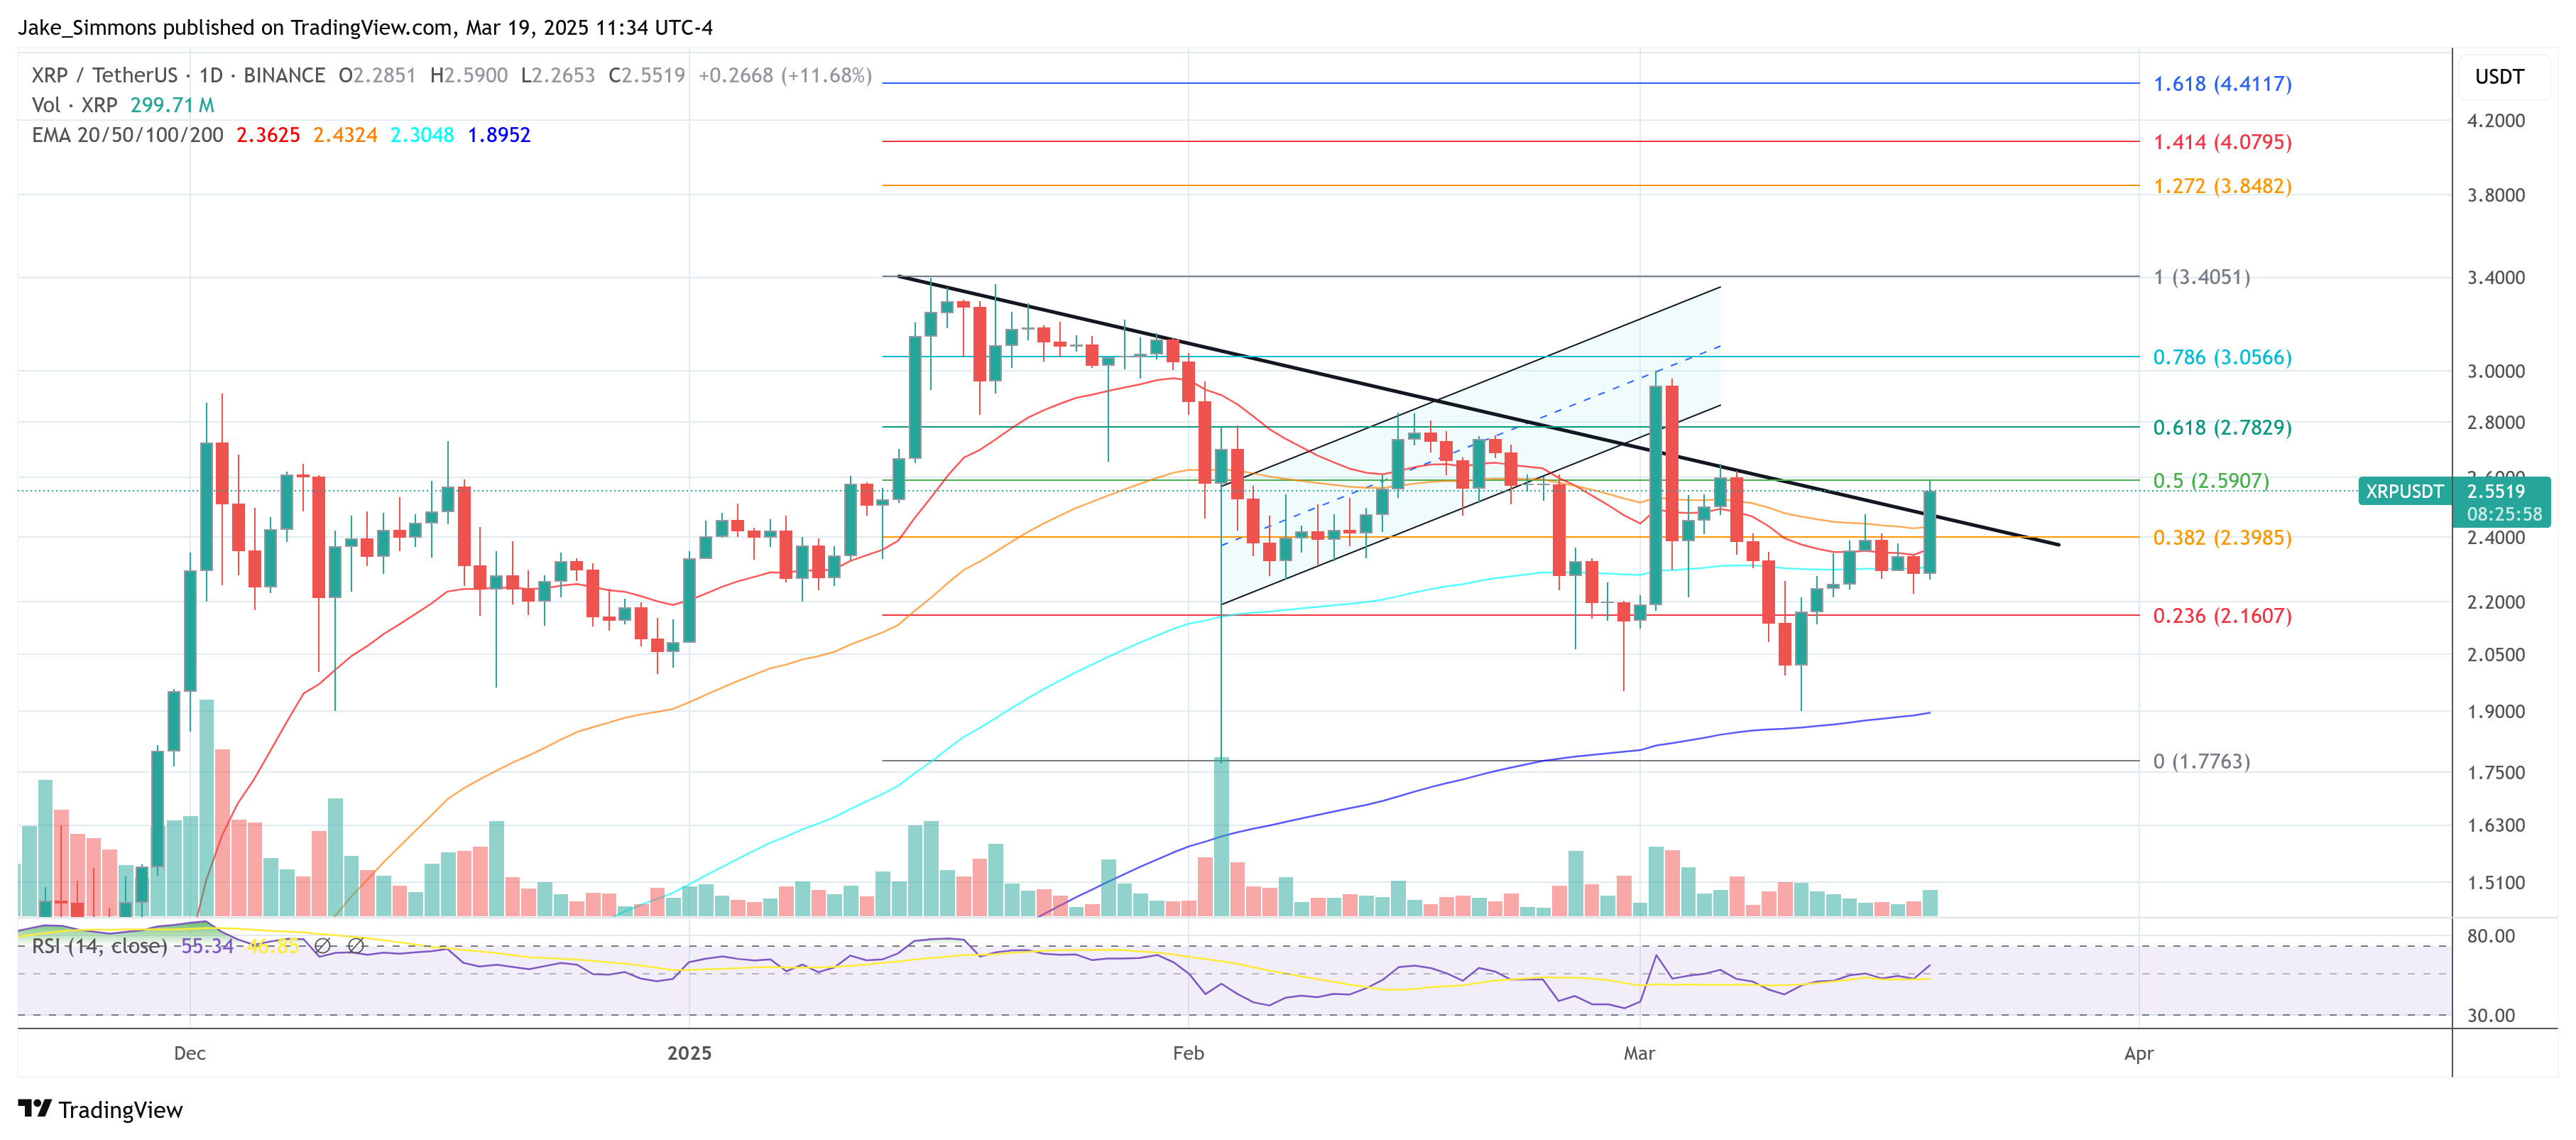
Against this backdrop, crypto analyst Dark Defender (@DefendDark) has shared an updated daily XRP/USD chart. According to it, XRP broke above a descending trend line that extends across several weeks of trading activity following the announcement.


The breakthrough near the $2.47 area, has been circled in green and labeled as “A Clear Break-Out” by Dark Defender, suggesting that market participants are no longer confined by the downward trajectory that characterized much of the previous price action.


XRP price analysis, 1-day chart


The chart also outlines a Elliott Wave count aligned precisely with Fibonacci retracement and extension levels. The chart illustrates a completed corrective phase and the early development of a new impulsive wave structure, supported by the decisive breakout from a long-standing descending trendline.


According to the analysis, Wave (1) initiated from the local low of $1.79 and peaked around $2.55, marking the first bullish impulse. This was followed by Wave (2), which retraced into the Fibonacci support zone.


The retracement respected the 61.80% level at $2.3073 and approached the 70.20% level at $2.2249, indicating a technically sound corrective wave within the Elliott framework. These levels provided a strong foundation for buyers, preventing further downside and signaling the potential completion of Wave (2).


Following the corrective phase, the chart projects the start of Wave (3), traditionally the strongest in Elliott Wave theory. Fibonacci extension levels are plotted to define the likely targets for this wave. The 161.80% extension aligns at $3.94, serving as a critical target zone for Wave (3). Additionally, the 261.80% extension near $3.78 further supports this zone as a potential area where bullish momentum might face resistance or temporary consolidation.


However, Dark Defender predicts that XRP could rise even higher into the $4.50 region. Upon completion of Wave (3), the chart suggests a corrective Wave (4), which is expected to respect the broader uptrend and drop into the $3.78 to $3.94 region.


Subsequently, the final impulsive Wave (5) is projected to extend upon the 361.80% Fibonacci level at $4.9274. This marks a potential high within the current Elliott Wave cycle by the analyst, with the possibility of a surge above $6, where the wave structure could culminate.

At press time, XRP traded at $2.55.
XRP price

Read more

  • Bitcoin Plunges 13% in a Week as Market Retreats to $60,000 Level
  • * The content presented above, whether from a third party or not, is considered as general advice only.  This article should not be construed as containing investment advice, investment recommendations, an offer of or solicitation for any transactions in financial instruments.

    goTop
    quote
    Related Articles
    placeholder
    Ethereum Drops Below $2,000 After Plunging Over 20% in a Month as Odds of $1,500 Retest SurgeEthereum Plunges Over 20% in a Month, Risking a Retest of $1,500 After Losing the $2,000 Defense Line.On November 13, Ethereum (ETH) plunged more than 5%, officially falling below the key
    Author  TradingKey
    Nov 13, Fri
    Ethereum Plunges Over 20% in a Month, Risking a Retest of $1,500 After Losing the $2,000 Defense Line.On November 13, Ethereum (ETH) plunged more than 5%, officially falling below the key
    placeholder
    Bitcoin lost its 200-day average — but the exit started three sessions before the CPIBitcoin fell 2.5% to about $73,400 on 11 November, an 11-week low, breaking its 200-day moving average near $73,100. The 24-hour liquidation tally reached $632 to $705 million, roughly 82% of it longs. But spot ETF outflows began three sessions earlier and USDT's market cap has shrunk $6.6 billion in 60 days — the leveraged length left before the inflation print did. A double top at 81,890 and 81,080 leaves a measured target of 69,366.
    Author  Suzie
    Nov 11, Wed
    Bitcoin fell 2.5% to about $73,400 on 11 November, an 11-week low, breaking its 200-day moving average near $73,100. The 24-hour liquidation tally reached $632 to $705 million, roughly 82% of it longs. But spot ETF outflows began three sessions earlier and USDT's market cap has shrunk $6.6 billion in 60 days — the leveraged length left before the inflation print did. A double top at 81,890 and 81,080 leaves a measured target of 69,366.
    placeholder
    Bitcoin Price Forecast: BTC faces pressure as weekly ETF outflows hit $1.28 billionBitcoin (BTC) remains under pressure on Monday, trading below the 50-week Simple Moving Average (SMA) at $75,222 after extending its losing streak to five consecutive weeks.
    Author  FXStreet
    Nov 09, Mon
    Bitcoin (BTC) remains under pressure on Monday, trading below the 50-week Simple Moving Average (SMA) at $75,222 after extending its losing streak to five consecutive weeks.
    placeholder
    Bitcoin ETFs sold $1.28 billion in a week — and BTC is still above 75,000US spot Bitcoin ETFs logged $1.28 billion of net outflows in the week to Nov 6, the largest since late June, with BlackRock's IBIT accounting for $1.21 billion. Yet BTC only fell from $80,405 to $74,940, a 6.8% move. The gap between the fund flow and the price is the story: leveraged longs were flushed, but spot holders did not follow the ETFs out — and $75,000 is the line that decides whether that reading holds.
    Author  Suzie
    Nov 09, Mon
    US spot Bitcoin ETFs logged $1.28 billion of net outflows in the week to Nov 6, the largest since late June, with BlackRock's IBIT accounting for $1.21 billion. Yet BTC only fell from $80,405 to $74,940, a 6.8% move. The gap between the fund flow and the price is the story: leveraged longs were flushed, but spot holders did not follow the ETFs out — and $75,000 is the line that decides whether that reading holds.
    placeholder
    Binance replaced 95% of a $6.3bn hole — Bitcoin is trading the plumbing, not the coinBinance resumed withdrawals on November 1 after a record $6.3bn theft. In the first 9.5 hours, users withdrew $4.64bn and deposited $1.01bn, a net outflow of $3.64bn, or 2.1% of assets. Bitcoin fell to 76,173 and is now 78,473. The market is pricing the exchange, not the supply.
    Author  Suzie
    Nov 02, Mon
    Binance resumed withdrawals on November 1 after a record $6.3bn theft. In the first 9.5 hours, users withdrew $4.64bn and deposited $1.01bn, a net outflow of $3.64bn, or 2.1% of assets. Bitcoin fell to 76,173 and is now 78,473. The market is pricing the exchange, not the supply.
    Live Quotes
    Name / SymbolChart% Change / Price
    XRPUSD
    XRPUSD
    0.00%0.00

    cryptocurrency Related Articles

    • Top 3 Price Prediction: Bitcoin, Ethereum, Ripple — Bulls take the reins, with $100K BTC, $3,500 ETH and $2.35 XRP in focus
    • Best Strategies When BTC Price Drops: From Hedging to Accumulating
    • How to Day Trade Crypto? Simplest Day Trading Strategy Ever
    • Trading Chart Patterns:Ultimate Guide to Price Action
    • Places that Provide Cheapest Ways to Buy Bitcoin In 2025
    • 10 Best Crypto With Most Potential to Buy and invest in 2025 - Top Picks from Expert Traders

    Click to view more