

Cardano Price Forecast: ADA stalls as undervalued MVRV signals long-term upside
- Cardano continues to struggle to break the 50-day EMA and reach $0.30 after Monday's 7% jump.
- The 365-day MVRV data indicates ADA as undervalued, implying scope for long-term gains.
- Derivatives data suggests a rise in ADA futures Open Interest despite a broadly bullish positional wipeout over the last 24 hours.
Cardano (ADA) rally is testing the 50-day Exponential Moving Average (EMA) at $0.2904 at press time on Wednesday, facing downside pressure amid a broader market stall following the recent recovery. The long-term outlook, based on Market Value to Realized Value (MVRV) readings, implies massive upside, as ADA may be undervalued. The retail sentiment remains mixed as the Cardano derivatives market sees a 24-hour rise in Open Interest, while total liquidations skew bearish.
On-chain data points to undervalued Cardano
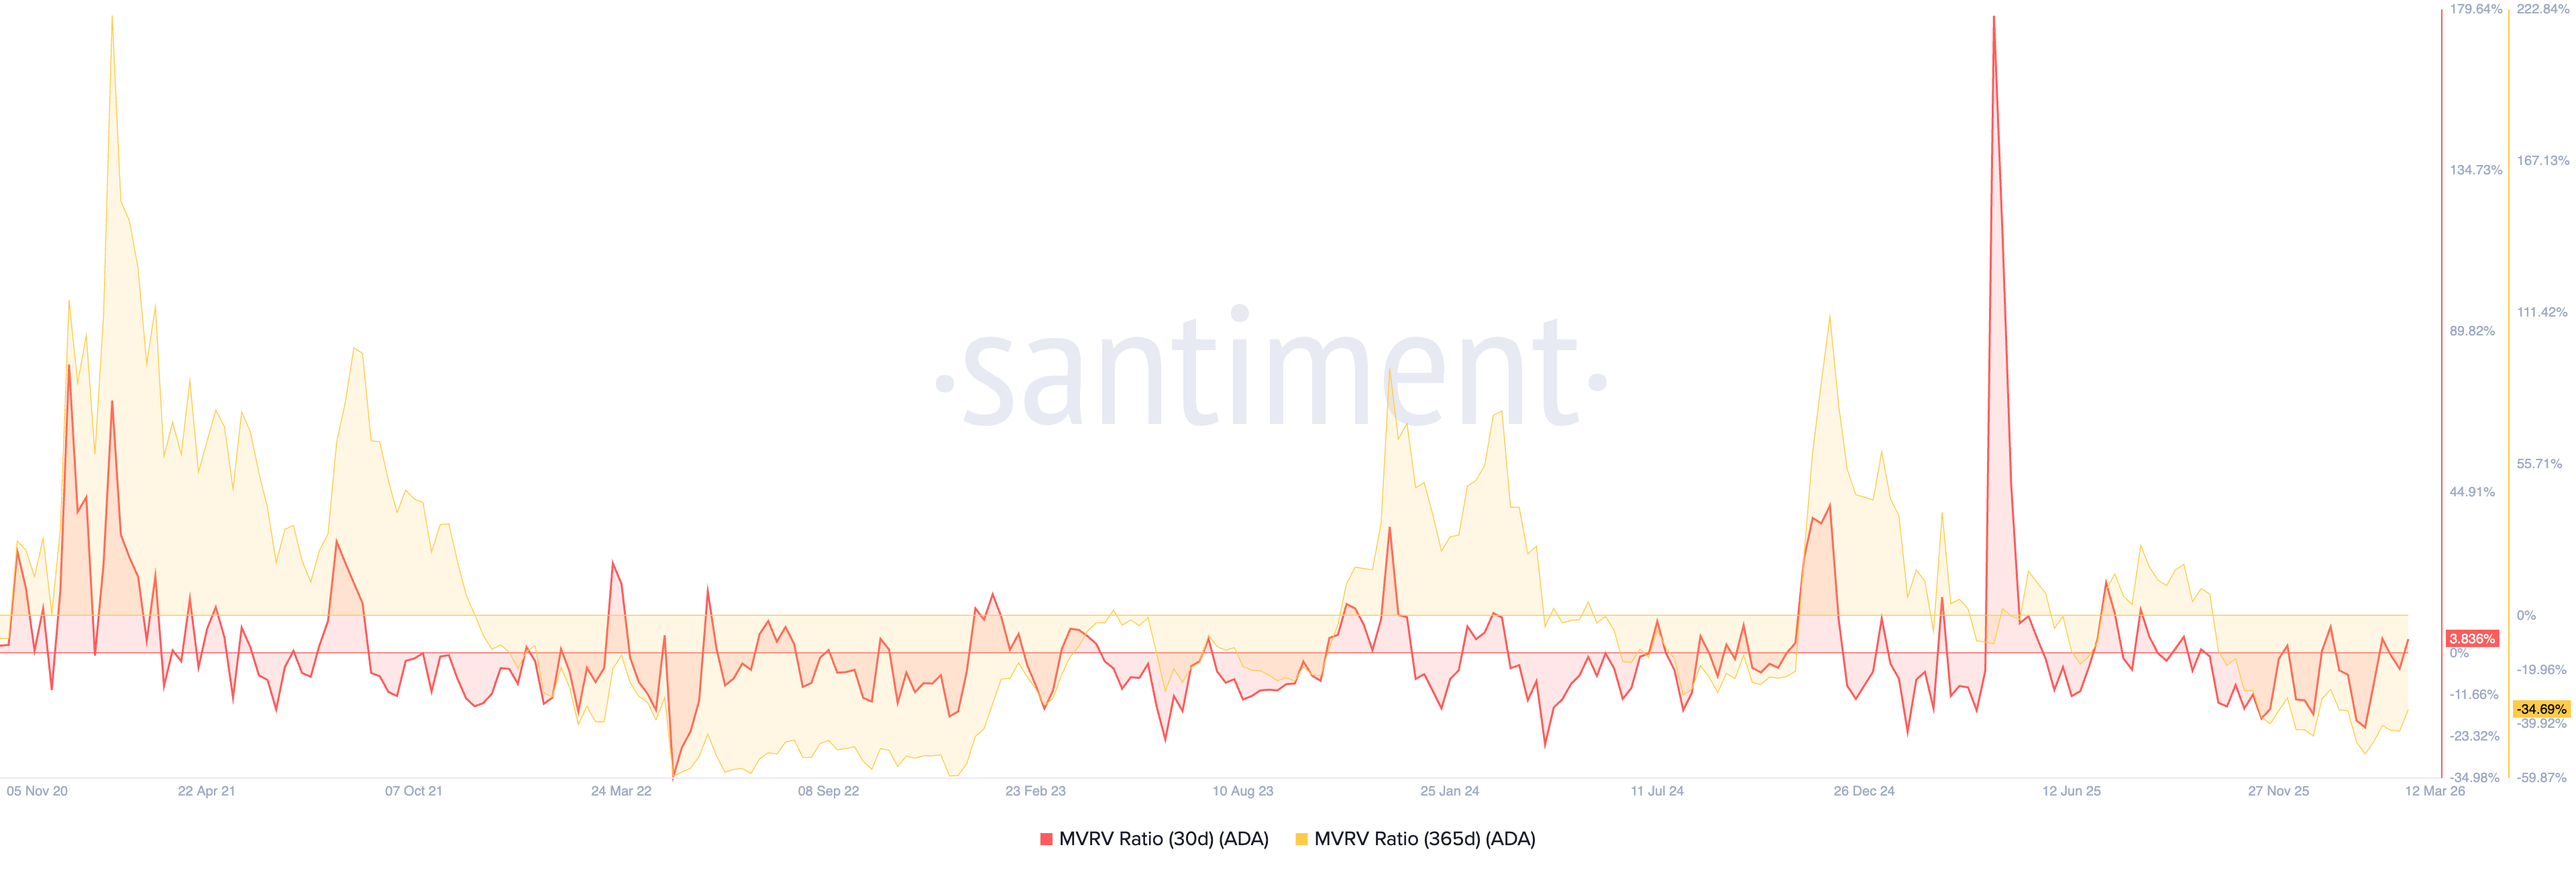
On-chain movement of ADA tokens over the last 365 days suggests that investors are underwater, implying that Cardano is undervalued at the moment. Santiment data shows that the MVRV reading – ratio of the market price to the average price of ADA tokens moved on-chain over the last 365 days – is at -34.69%, suggesting long-term upside potential for Cardano.
The last time Cardano’s 365-day MVRV dropped below -30% was in December 2023, before the 58% rise in January 2023.
However, the MVRV over the last 30 days stands at 3.83%, implying that the short-term traders are slightly above breakeven, which caps the near-term upside under the threat of profit-taking.
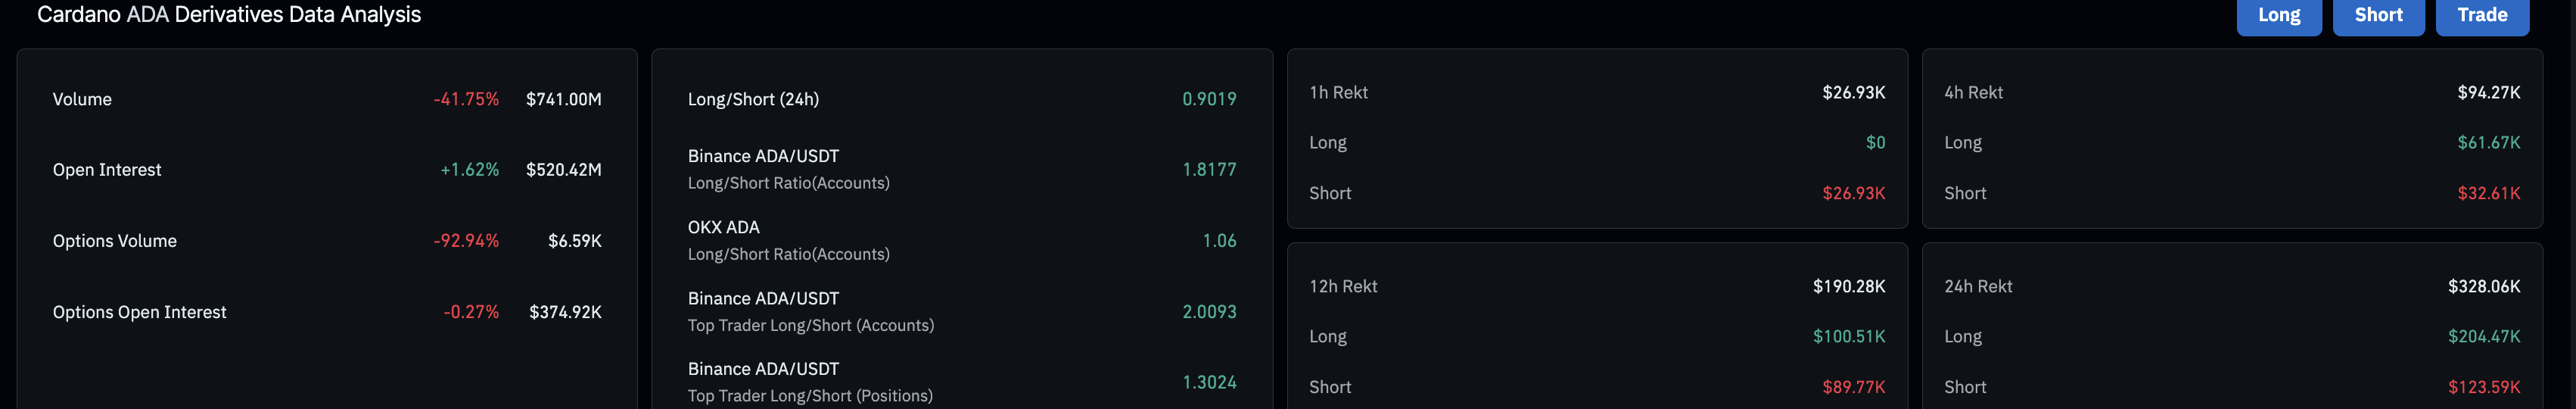
Meanwhile, Cardano’s futures Open Interest (OI) is up 1.62% in the last 24 hours, reaching $520.42 million, suggesting increased positional buildup as the notional value of outstanding contracts rises.
However, the total liquidations over the last 24 hours amount to $328,060, led by long liquidations of $204,470, reflecting a broadly bullish positional wipeout, which has dropped the long-to-short ratio to 0.9019. As a larger number of short positions are active in Cardano derivatives, the bias shifts bearish.
Could Cardano extend its rally above $0.30?
Cardano is trading above $0.2900 at press time on Wednesday, sustaining the 7% gains from Monday.
The near-term bias is cautiously bullish as ADA tests the 50-day EMA at $0.2903 following the breakout of the descending resistance line on Monday. A decisive daily close above the 50-day EMA could face the falling 100- and 200-day EMAs, framing the rally as an early recovery phase within a larger downtrend.
On the upside, ADA should close above the February 2 close at $0.2991 to reinstate an upward trend, which could target the R1 Pivot Point at $0.3329.
The Moving Average Convergence Divergence (MACD) stands marginally above its signal line and slightly above the zero line, with a modestly expanding positive histogram, suggesting improving bullish momentum. The Relative Strength Index (RSI) at 58 remains below overbought territory yet above the midline, suggesting upward pressure rather than exhaustion.
Looking down, Cardano's initial support is at the former trendline breakout region near $0.2770, followed by the February 5 low at $0.2436.
(The technical analysis of this story was written with the help of an AI tool.)
Recommended Articles


