

XRP Surges 10% in a Week As Indicators Point to Sustainable Momentum

- Gold Price Forecast: Gold Poised to Break $4,200 as Oil Price Slump Eases Inflation Fears
- Gold Price Forecast: Oil Price Breaking $100 Fuels Inflation Concerns, Will Gold Prices Fall Further?
- Middle East War updates: US-Iran pause strikes as Trump weighs up diplomatic options
- WTI climbs above $87.00 as Middle East conflict threatens key choke points
- Today’s Market Recap: Oil Breaks $100, Fueling Inflation Fears, as AI Capex Faces Scrutiny and Tesla’s 14% Plunge Drags Down Tech Sector
- WTI Crude Breaks $90, Brent Crude Approaches $100, Middle East Shipping Risks Drive Continuous Rise in Oil Prices

XRP is up 22% in the past seven days, with its price reclaiming ground above the $2 mark for the first time in months. The rally has sparked renewed interest, with technical indicators flashing signs of both strength and caution.
Momentum has cooled slightly, as shown by the RSI pulling back from near-overbought levels, but the broader setup remains bullish.
XRP RSI Has Cooled After Nearing Overbought Levels
XRP’s Relative Strength Index (RSI) is currently at 60.5, marking a notable cooldown from yesterday’s 67.8.
This comes after a sharp rise from 34.7 just six days ago, indicating that XRP recently went from oversold conditions to near-overbought levels before pulling back.
The move suggests a rapid shift in momentum that may now be stabilizing, potentially reflecting short-term profit-taking after a strong rally.
 XRP RSI. Source: TradingView.
The RSI is a momentum oscillator that measures the speed and change of price movements, typically on a scale of 0 to 100.
Readings below 30 are considered oversold, suggesting potential undervaluation or exhaustion in selling pressure, while readings above 70 indicate overbought conditions, often signaling a possible correction or slowdown.
With XRP’s RSI now at 60.5, it sits in a neutral-to-bullish zone.
This level may suggest that while the recent bullish momentum has cooled, there could still be room for upside if buying interest resumes — but it also means the asset is no longer in an ideal “undervalued” zone for fresh entries.
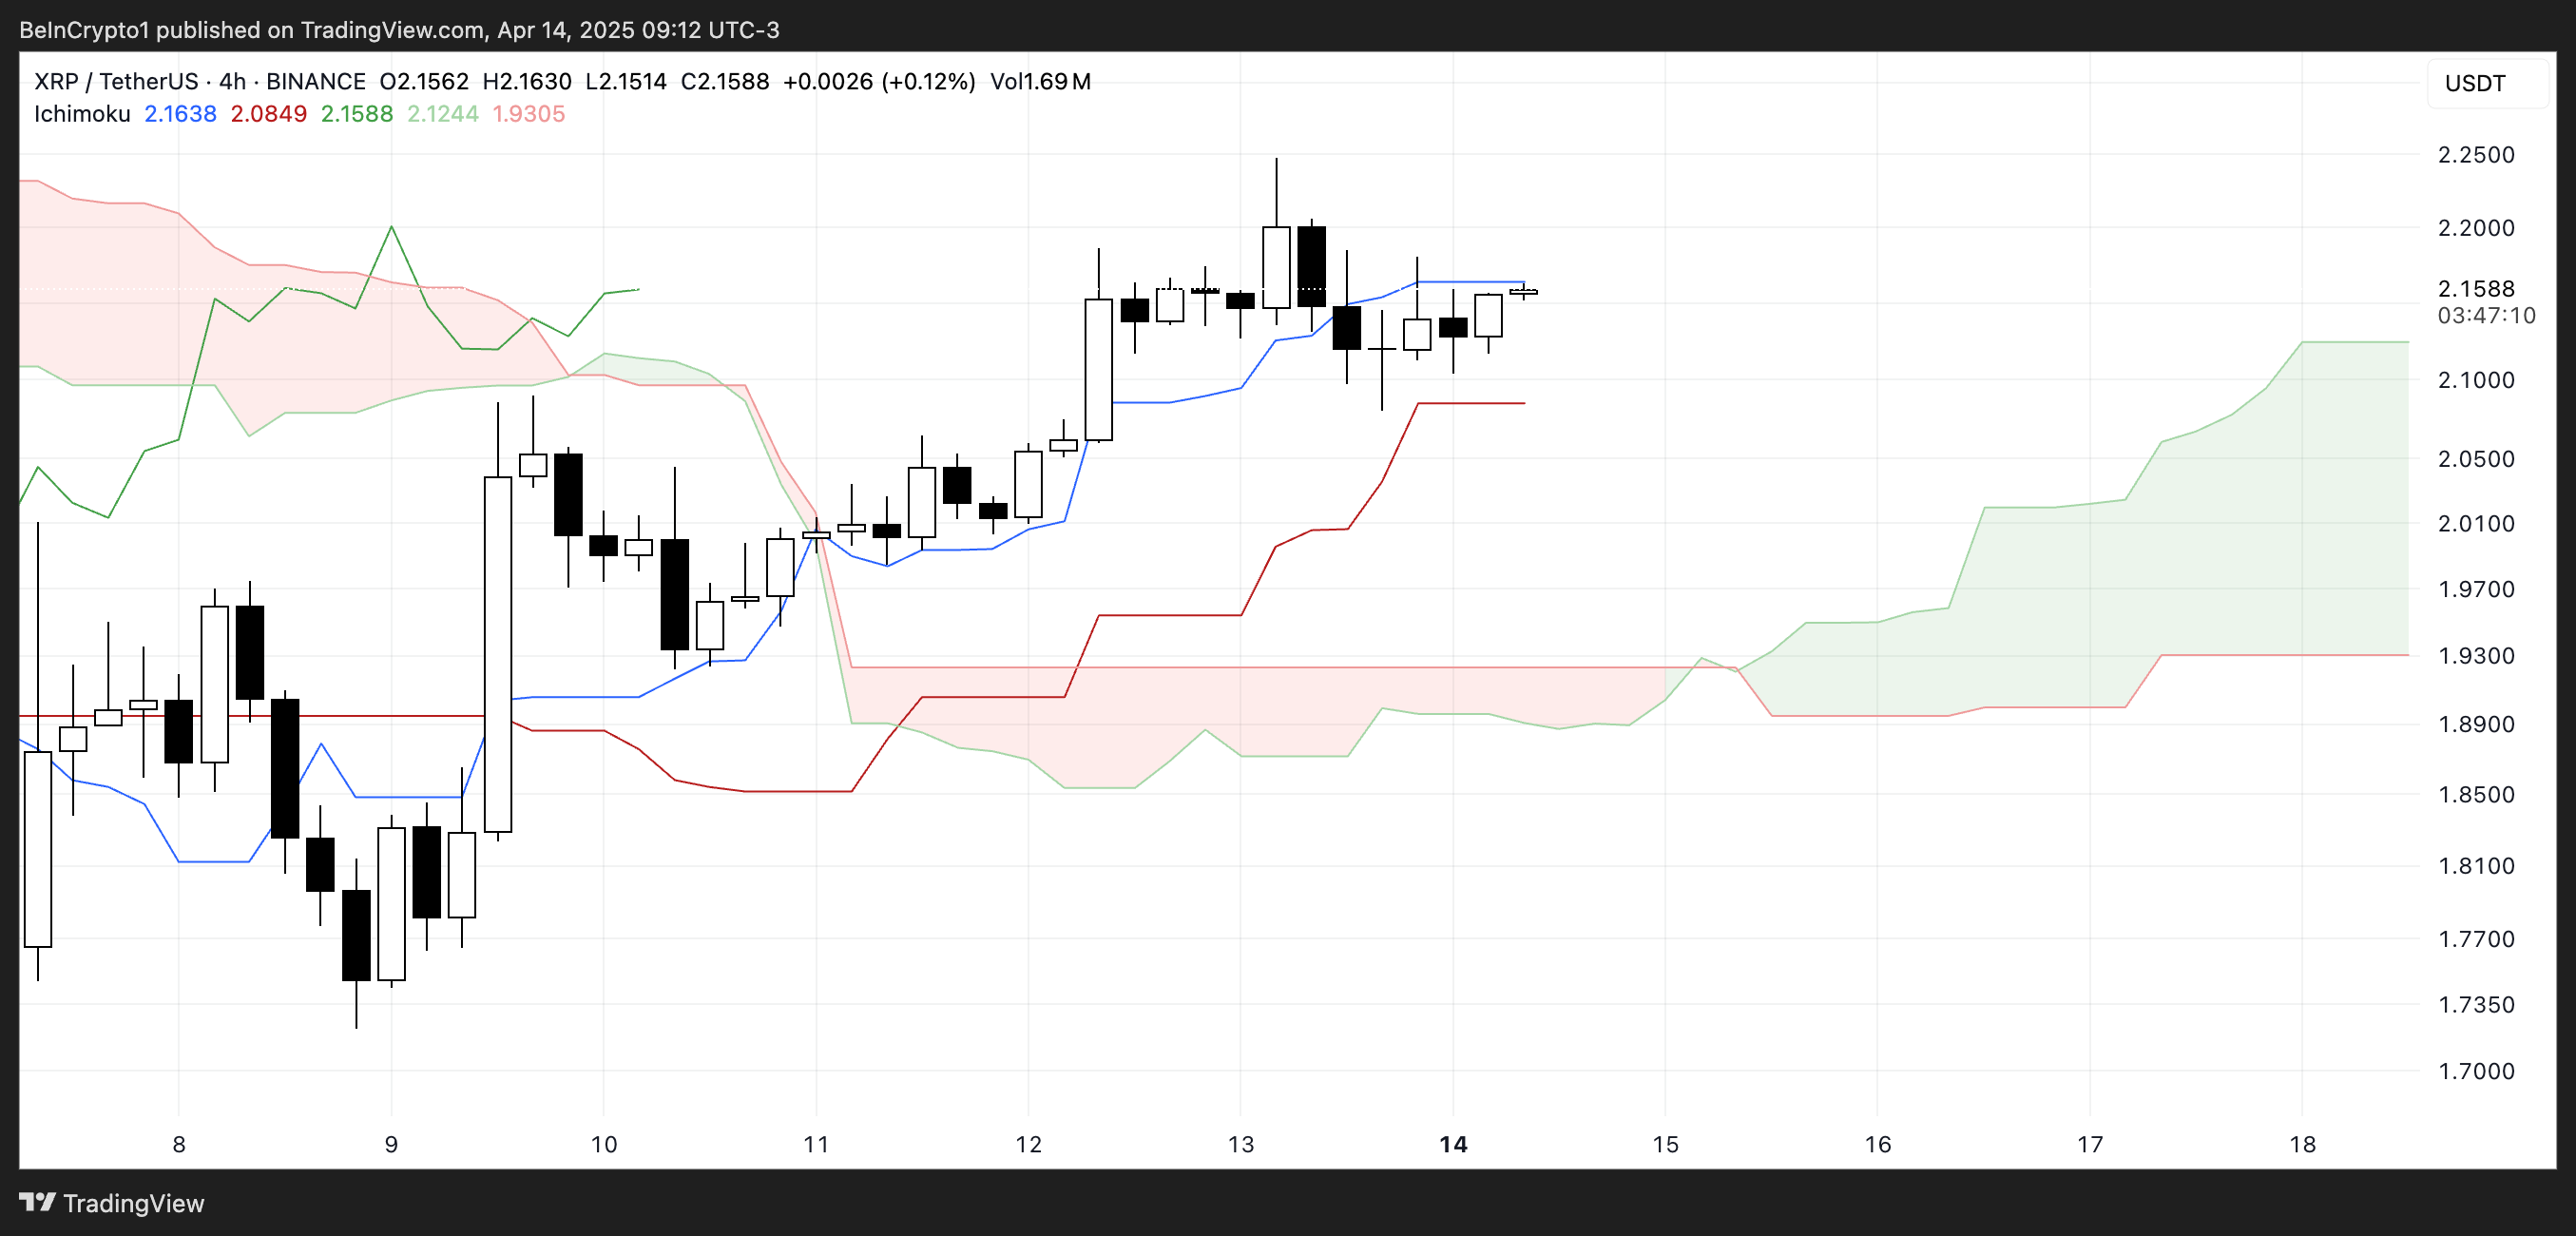
XRP Ichimoku Cloud Shows a Bullish Setup
The Ichimoku Cloud for XRP currently shows a bullish setup, with the price positioned above both the blue conversion line (Tenkan-sen) and the red base line (Kijun-sen).
This alignment indicates that short-term and medium-term momentum remains in favor of the bulls. The leading span A (green cloud boundary) is above leading span B (red cloud boundary), forming a green cloud ahead—a classic sign of a bullish trend continuation.
Moreover, the price has stayed above the cloud for several sessions, reinforcing the positive momentum.
 XRP Ichimoku Cloud. Source: TradingView.
However, the narrowing gap between the Tenkan-sen and Kijun-sen, along with the flatlining of both lines, suggests that bullish momentum may be pausing or weakening in the short term.
If the price continues to consolidate sideways while staying above the cloud, it may indicate a healthy consolidation before a potential continuation higher.
But a drop below the Kijun-sen could trigger caution, as it would suggest a shift in momentum. For now, the overall cloud structure remains supportive of a bullish bias unless a deeper pullback pushes the price back into or below the cloud.
Will XRP Rise To Test $2.50 Soon?
XRP’s EMA lines are tightening, hinting at a potential golden cross formation — a bullish signal that occurs when the short-term EMA crosses above the long-term EMA.
This setup often marks the beginning of an upward trend, especially when supported by strong volume and positive momentum.
If the Golden Cross confirms, it could act as a catalyst for the XRP price to push toward higher resistance levels. The next key area to watch is around $2.23.
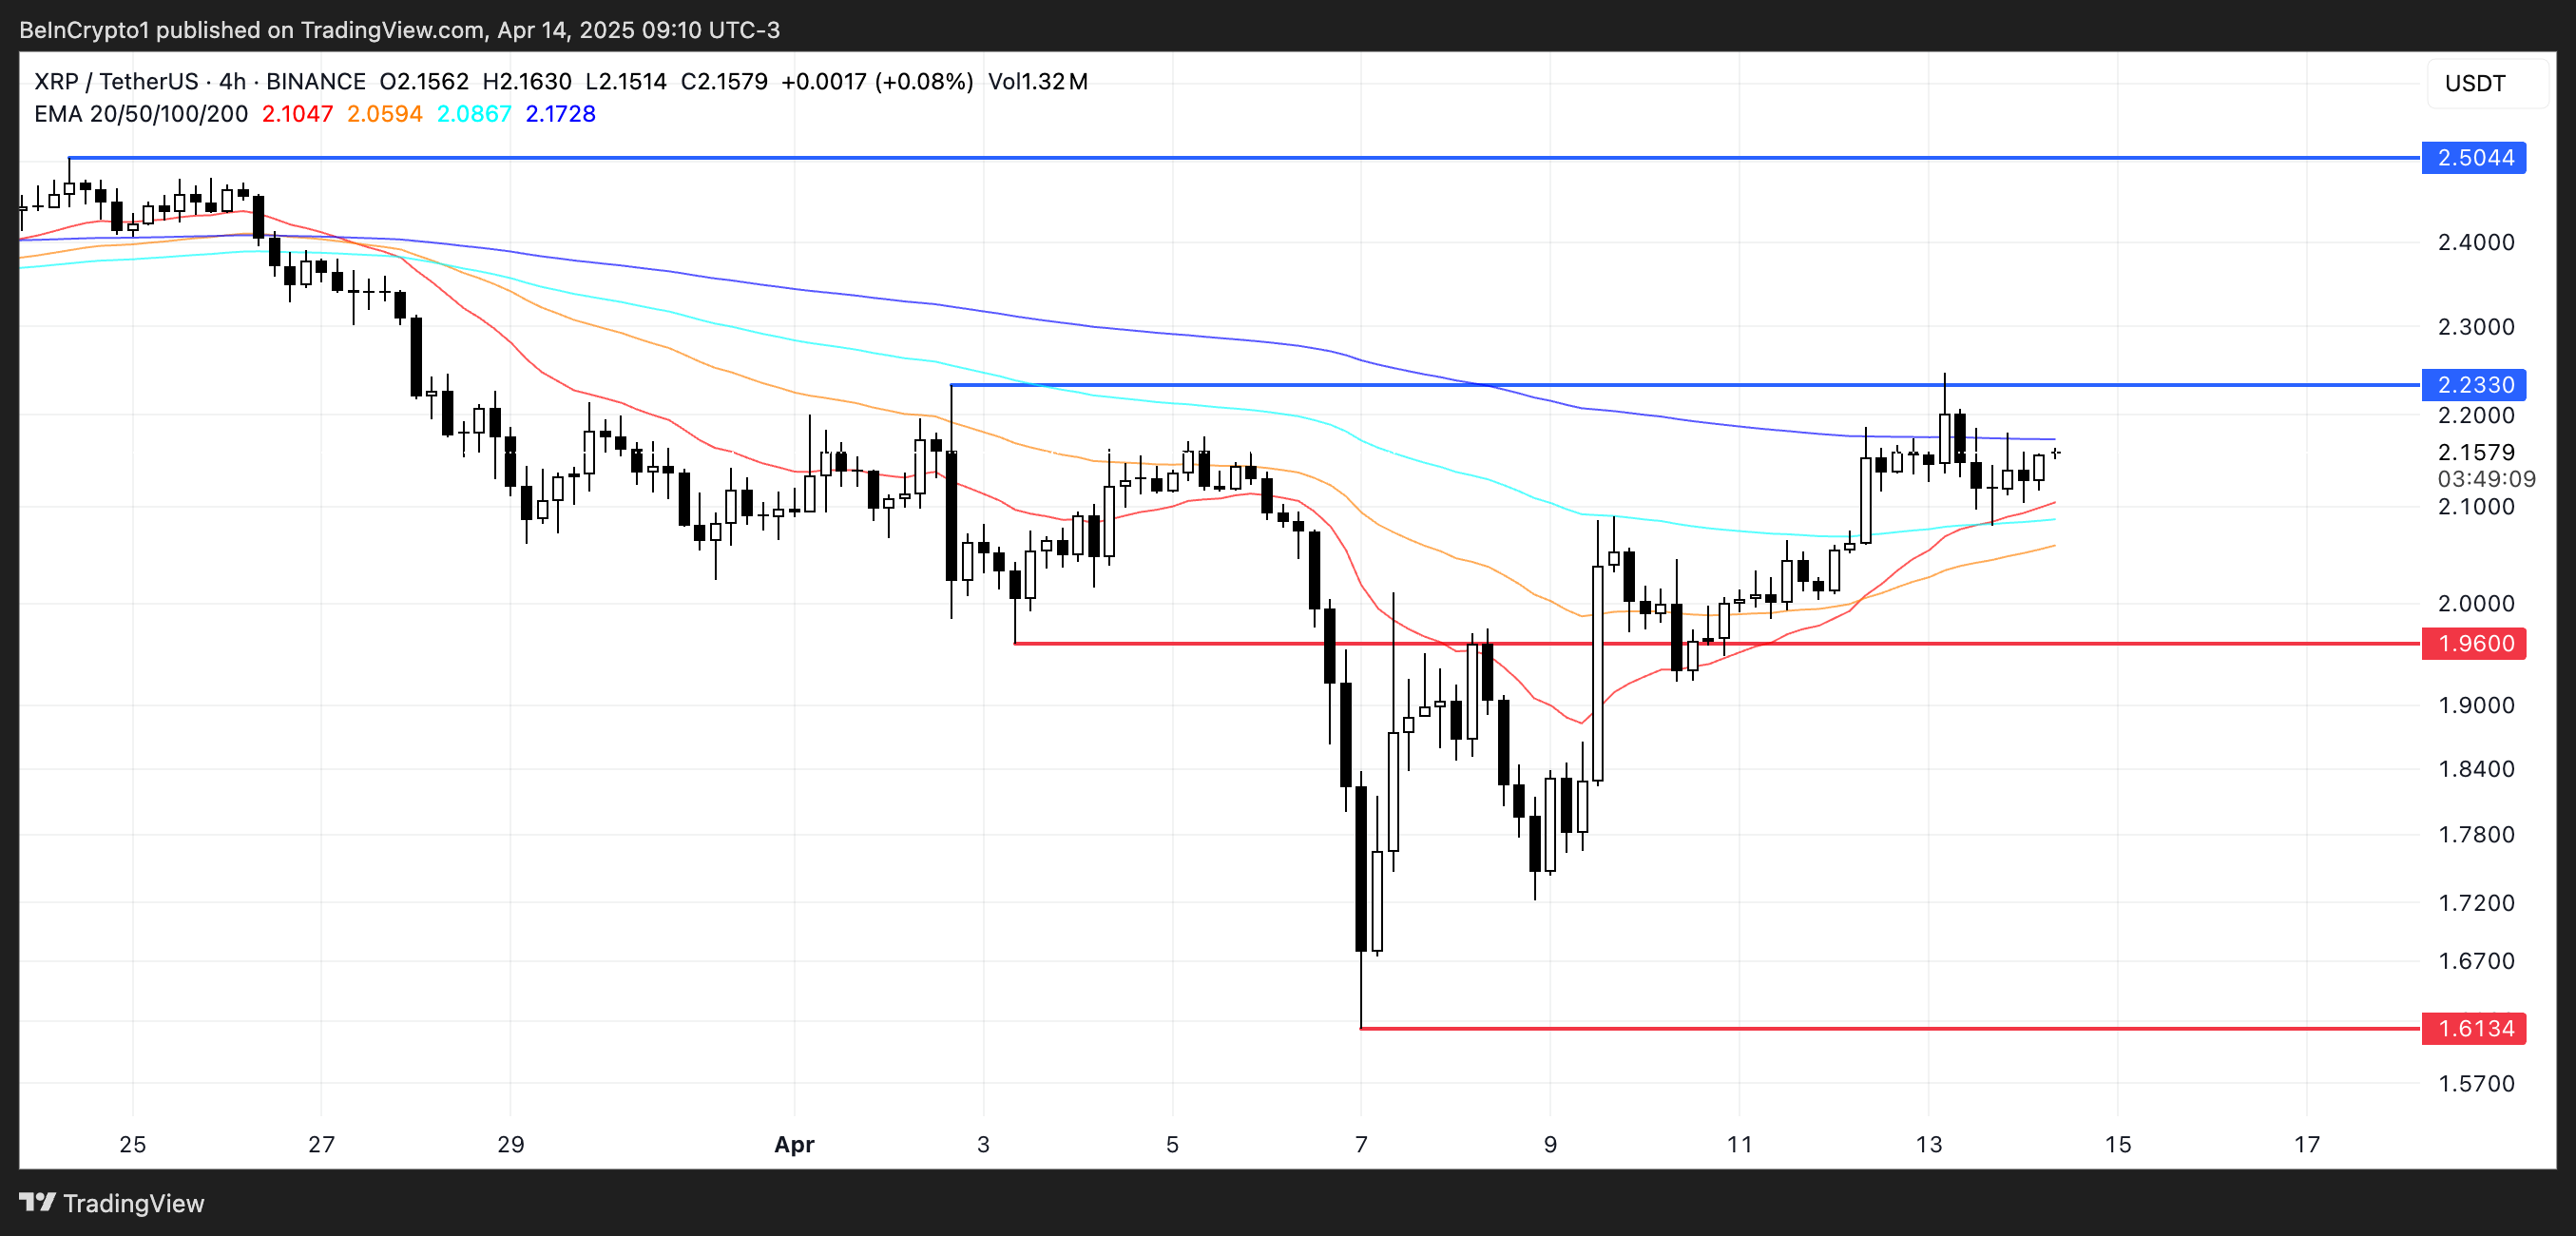 XRP Price Analysis. Source: TradingView.
A clean breakout above that level could open the path toward $2.50, as bullish traders gain confidence.
However, the momentum needs to hold. If buying pressure fades and XRP fails to sustain its climb, a pullback could occur, with $1.96 acting as the first key support to monitor.
A breakdown below this level could shift sentiment bearish in the short term, potentially dragging the price down toward $1.61.
Read more
* The content presented above, whether from a third party or not, is considered as general advice only. This article should not be construed as containing investment advice, investment recommendations, an offer of or solicitation for any transactions in financial instruments.


