Litecoin Breaks Under Parallel Channel: Analyst Predicts This Target

Mitrade
coverImg
Source: DepositPhotos

An analyst has pointed out how Litecoin has slipped under a parallel channel recently and could be set to see a move to this price level.


Litecoin Has Broken Under Parallel Channel Support


In a new post on X, analyst Ali Martinez has discussed about a parallel channel for Litecoin. The “parallel channel” refers to a pattern from technical analysis (TA) that forms when the price of an asset consolidates between two parallel trendlines.


There are three types of parallel channels, but in the context of the current topic, the one where the channel is parallel to the time-axis is of interest. In this pattern, the trendlines track successive highs and lows of roughly equal magnitude. That is, the asset is consolidating completely sideways when inside the channel.

The upper line of the parallel channel is likely to be a source of resistance for the price in the future, meaning that tops can occur there. Similarly, the lower level can be where bottoms take place.


If the asset manages to break past either of these barriers, however, then it may go on to see a continuation of trend in that direction. That is, an escape above the channel can be a bullish signal, while a fall under it can be a bearish one.


As mentioned before, there are other types of parallel channels as well. Namely, the ascending and descending versions. These occur when the trendlines have a slope to them. That is, when the price’s consolidation happens towards a net upside or downside. Naturally, the ascending channel forms when the slope is positive and the descending one when it’s negative.


Until recently, the daily price of Litecoin was potentially trading inside a parallel channel. Here’s the chart shared by the analyst, that shows this pattern for the cryptocurrency:
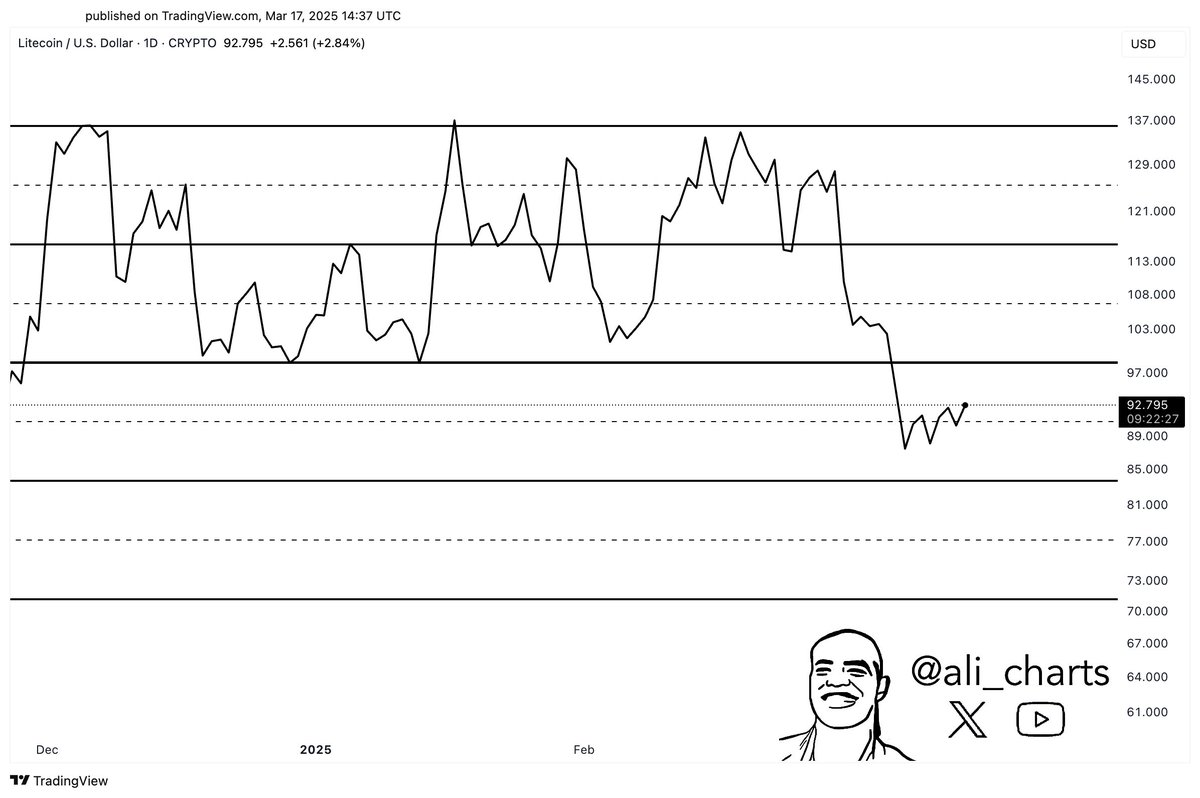

Litecoin Parallel Channel

From the graph, it’s visible that the recent bearish action in Litecoin has meant that its price has fallen under the parallel channel. If the pattern holds, this breakout would mean a bearish outcome for the asset.


Generally, moves emerging out of a parallel channel are of the same length as the height of the pattern itself. Based on this, the analyst has put a target for LTC. “Exiting this channel sets up a price move to $70,” notes Martinez.


Since the plunge under the lower trendline of the pattern has happened, Litecoin has been moving down. It only remains to be seen, though, whether the decline would extend to this price target or not.


LTC Price

Litecoin has suffered a drop of almost 6% in the last 24 hours, which has erased the earlier recovery and brought its price down to $88.


Litecoin Price Chart

Read more

  • Australian Dollar declines below 0.6750 after RBA minutes, US Retail Sales data in focus
  • Nvidia Q3 Earnings Loom as Market Expects Revenue Near $109 Billion: Can NVDA Stock Hold $150?
  • Bitcoin Plunges 13% in a Week as Market Retreats to $60,000 Level
  • * The content presented above, whether from a third party or not, is considered as general advice only.  This article should not be construed as containing investment advice, investment recommendations, an offer of or solicitation for any transactions in financial instruments.

    goTop
    quote
    Related Articles
    placeholder
    Nvidia posts record $115.8B Q3 revenue, but crypto stays mutedThe crypto market remained subdued on Tuesday despite Nvidia's (NVDA) Q3 earnings release beating analysts' expectations as demand for artificial intelligence infrastructure continued to drive growth across its business.
    Author  FXStreet
    17 hours ago
    The crypto market remained subdued on Tuesday despite Nvidia's (NVDA) Q3 earnings release beating analysts' expectations as demand for artificial intelligence infrastructure continued to drive growth across its business.
    placeholder
    Ethereum Drops Below $2,000 After Plunging Over 20% in a Month as Odds of $1,500 Retest SurgeEthereum Plunges Over 20% in a Month, Risking a Retest of $1,500 After Losing the $2,000 Defense Line.On November 13, Ethereum (ETH) plunged more than 5%, officially falling below the key
    Author  TradingKey
    Nov 13, Fri
    Ethereum Plunges Over 20% in a Month, Risking a Retest of $1,500 After Losing the $2,000 Defense Line.On November 13, Ethereum (ETH) plunged more than 5%, officially falling below the key
    placeholder
    Bitcoin lost its 200-day average — but the exit started three sessions before the CPIBitcoin fell 2.5% to about $73,400 on 11 November, an 11-week low, breaking its 200-day moving average near $73,100. The 24-hour liquidation tally reached $632 to $705 million, roughly 82% of it longs. But spot ETF outflows began three sessions earlier and USDT's market cap has shrunk $6.6 billion in 60 days — the leveraged length left before the inflation print did. A double top at 81,890 and 81,080 leaves a measured target of 69,366.
    Author  Suzie
    Nov 11, Wed
    Bitcoin fell 2.5% to about $73,400 on 11 November, an 11-week low, breaking its 200-day moving average near $73,100. The 24-hour liquidation tally reached $632 to $705 million, roughly 82% of it longs. But spot ETF outflows began three sessions earlier and USDT's market cap has shrunk $6.6 billion in 60 days — the leveraged length left before the inflation print did. A double top at 81,890 and 81,080 leaves a measured target of 69,366.
    placeholder
    Bitcoin Price Forecast: BTC faces pressure as weekly ETF outflows hit $1.28 billionBitcoin (BTC) remains under pressure on Monday, trading below the 50-week Simple Moving Average (SMA) at $75,222 after extending its losing streak to five consecutive weeks.
    Author  FXStreet
    Nov 09, Mon
    Bitcoin (BTC) remains under pressure on Monday, trading below the 50-week Simple Moving Average (SMA) at $75,222 after extending its losing streak to five consecutive weeks.
    placeholder
    Bitcoin ETFs sold $1.28 billion in a week — and BTC is still above 75,000US spot Bitcoin ETFs logged $1.28 billion of net outflows in the week to Nov 6, the largest since late June, with BlackRock's IBIT accounting for $1.21 billion. Yet BTC only fell from $80,405 to $74,940, a 6.8% move. The gap between the fund flow and the price is the story: leveraged longs were flushed, but spot holders did not follow the ETFs out — and $75,000 is the line that decides whether that reading holds.
    Author  Suzie
    Nov 09, Mon
    US spot Bitcoin ETFs logged $1.28 billion of net outflows in the week to Nov 6, the largest since late June, with BlackRock's IBIT accounting for $1.21 billion. Yet BTC only fell from $80,405 to $74,940, a 6.8% move. The gap between the fund flow and the price is the story: leveraged longs were flushed, but spot holders did not follow the ETFs out — and $75,000 is the line that decides whether that reading holds.
    Live Quotes
    Name / SymbolChart% Change / Price
    LTCUSD
    LTCUSD
    0.00%0.00

    cryptocurrency Related Articles

    • Top 3 Price Prediction: Bitcoin, Ethereum, Ripple — Bulls take the reins, with $100K BTC, $3,500 ETH and $2.35 XRP in focus
    • Best Strategies When BTC Price Drops: From Hedging to Accumulating
    • How to Day Trade Crypto? Simplest Day Trading Strategy Ever
    • Trading Chart Patterns:Ultimate Guide to Price Action
    • Places that Provide Cheapest Ways to Buy Bitcoin In 2025
    • 10 Best Crypto With Most Potential to Buy and invest in 2025 - Top Picks from Expert Traders

    Click to view more