

Meme Coins Price Prediction: DOGE, SHIB, and PEPE rise as broader crypto market recovers

- Gold drops below $4,700 on stronger US Dollar, Middle East tensions
- Bitcoin Returns to $79,000 Level. Prediction Markets Bullish on Breaking $80,000 in April
- Gold holds steady near $4,600 as Fed rate decision looms
- Fed FOMC Meeting Is Approaching: Where Is the Focus? Will There Be More Rate Cuts This Year?
- Goldman Sachs: Structurally Bullish on Gold to $5,400, But Warns of Short-Term Pullback
- Today’s Market Recap: Fed Dissent and AI Capex Surges Define Volatile Earnings Week

Dogecoin holds at critical support, ticking up after five consecutive days of losses.
Shiba Inu begins the week regaining strength and targeting a key resistance trendline.
Pepe’s trend reversal gains momentum in the 4-hour chart.
Meme coins Dogecoin (DOGE), Shiba Inu (SHIB), and Pepe (PEPE) register a bright start to the week, concurrent with the broader cryptocurrency market recovery. Dogecoin and Shiba Inu present the possibility of a double bottom reversal with a bullish RSI divergence, while Pepe’s reversal overcomes a key level as its momentum grows.
Dogecoin’s first uptick in six days
Dogecoin trades in the green by almost 1% at press time on Monday as it bounces off the $0.1710 support level formed by the lowest closing price in June. With a potential tweezer bottom in making, Dogecoin prepares for its second turnaround from this level.
This could trigger a double bottom pattern possibility with a neckline at $0.1987, the closing price of June 10. Thus, DOGE shows potential to test the immediate resistance at this level.
A potential closing above the neckline could extend the breakout rally towards the $0.2506 peak formed on May 10.
The Relative Strength Index (RSI) momentum indicator at 40 gradually recovers from the oversold boundary in the daily chart, while DOGE records a second bottom at the $0.1710 support floor. This signals a bullish RSI divergence supporting uptrend chances with significant room for growth before reaching the overbought zone.
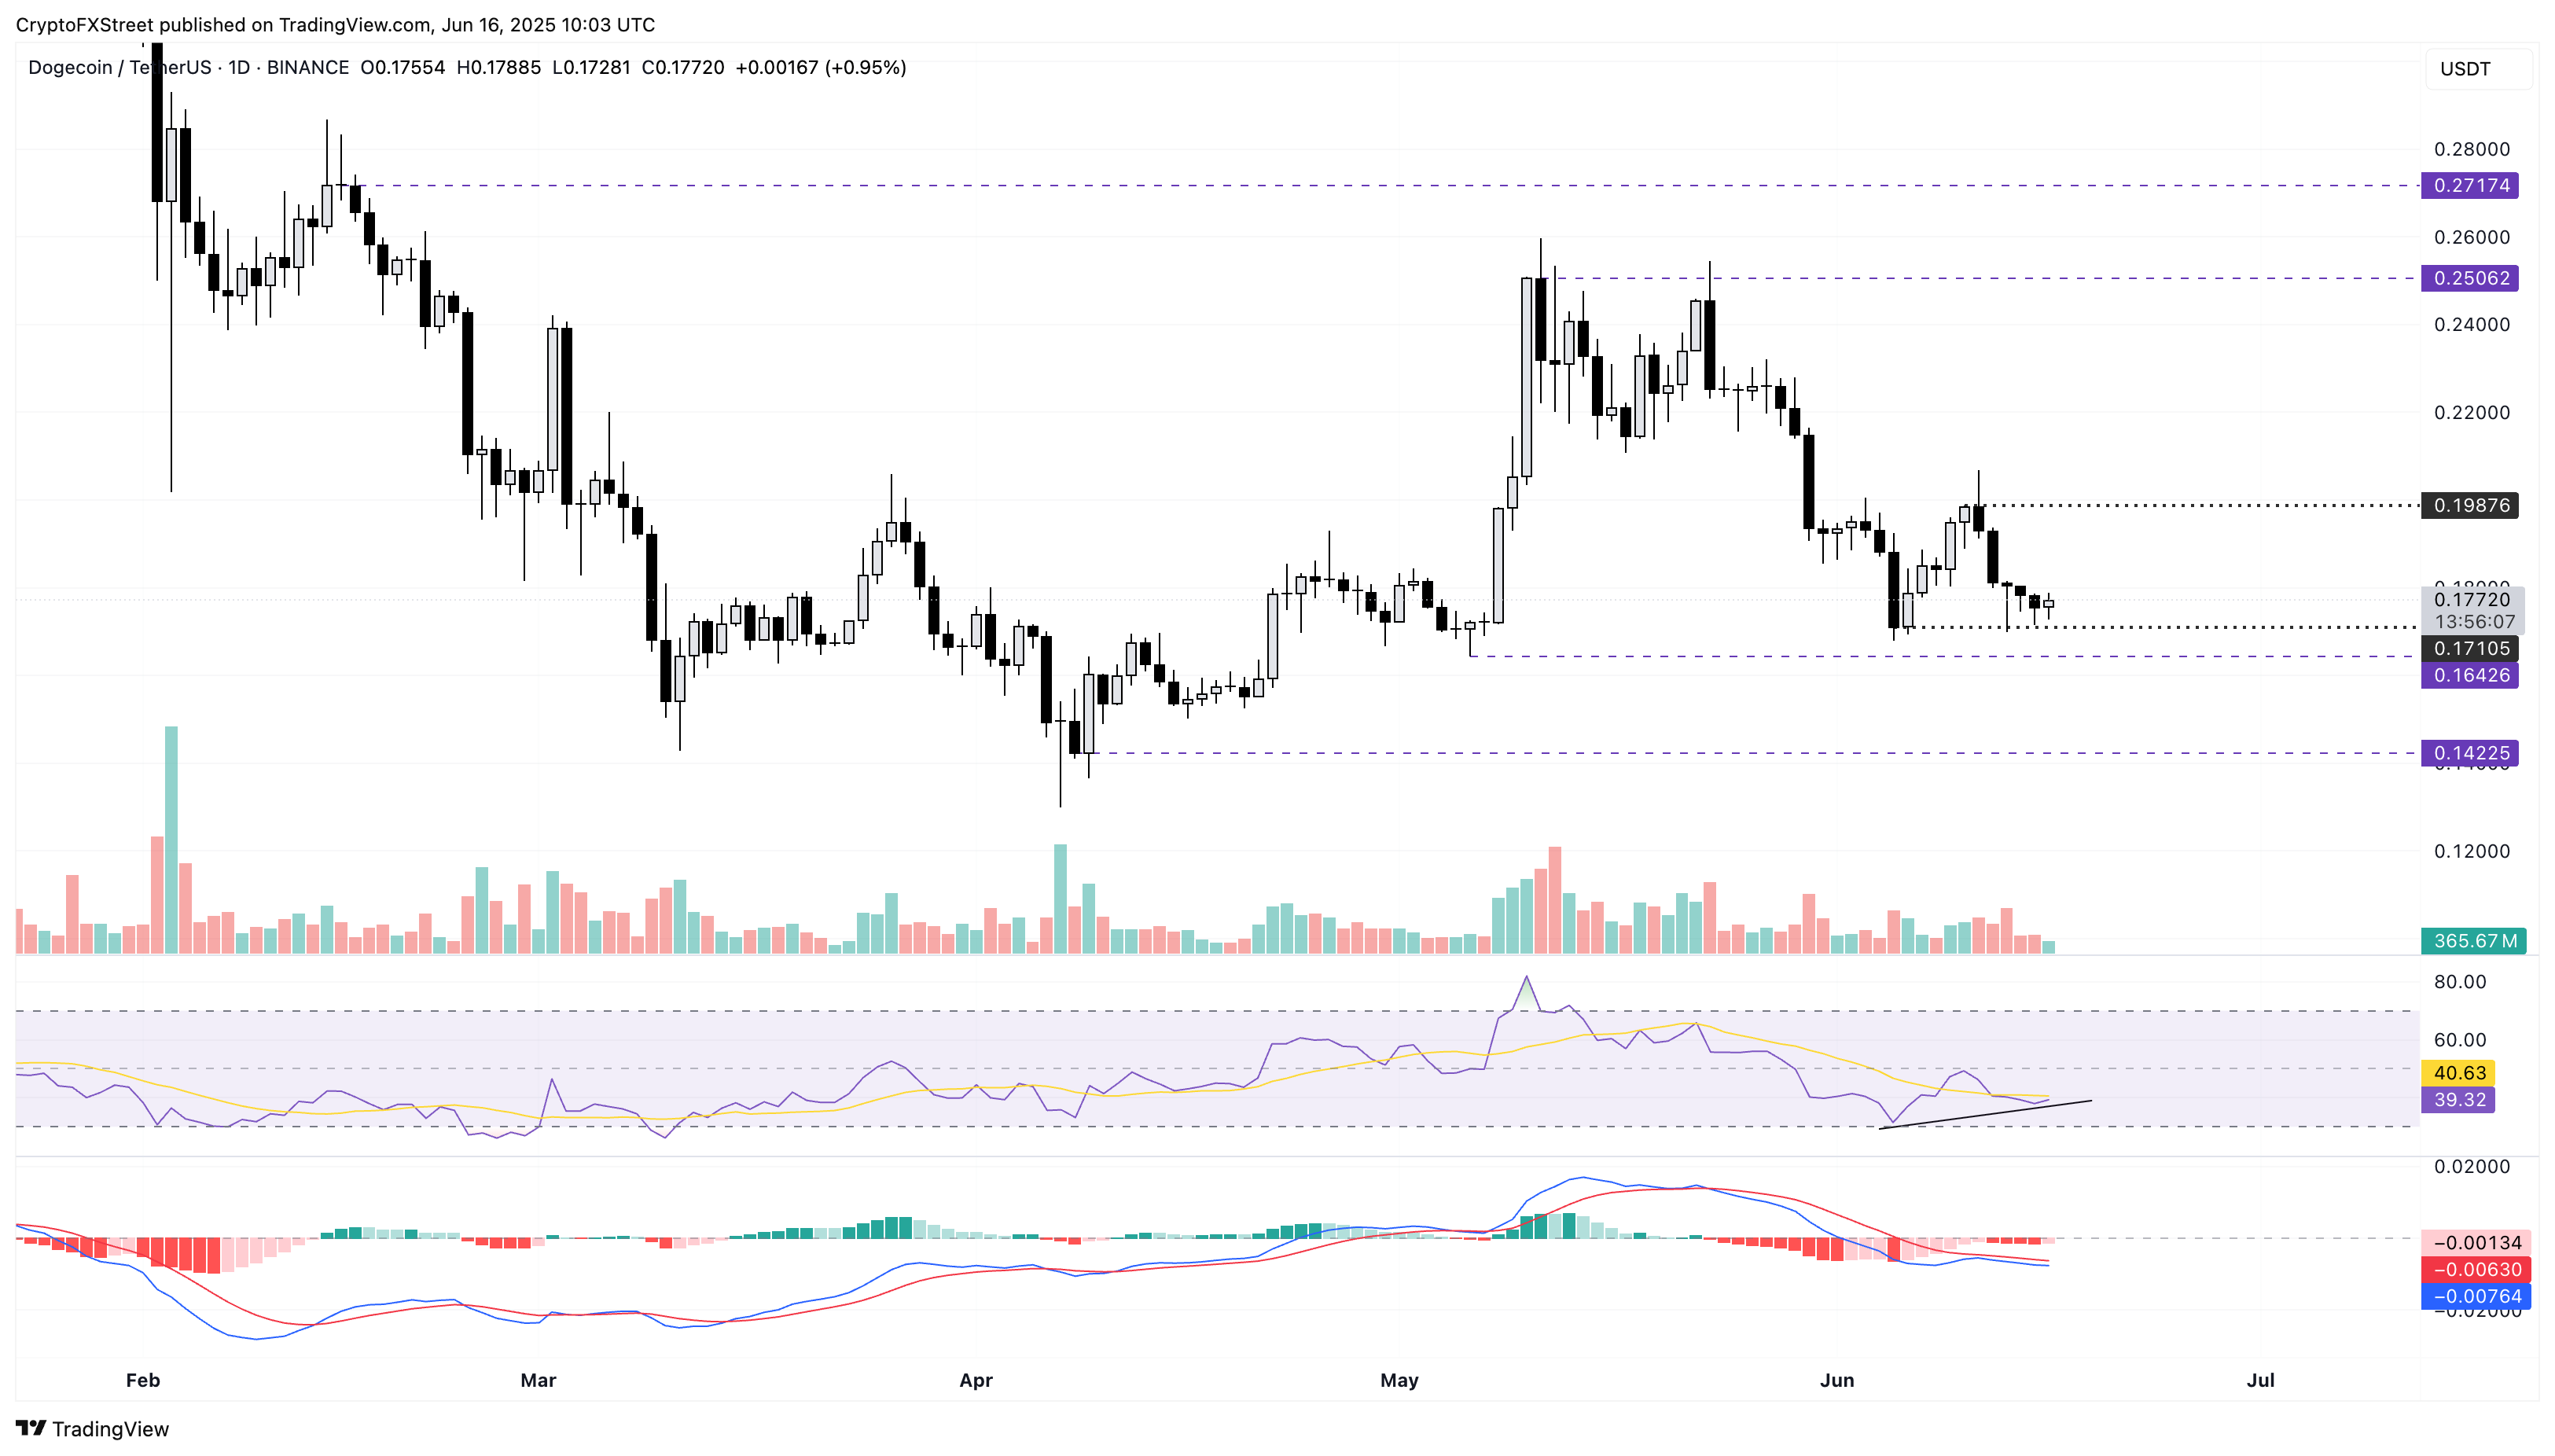
DOGE/USDT daily price chart.
However, a closing below $0.1710 will nullify the double bottom pattern. In such a scenario, DOGE could test the $0.1642 support formed on May 6.
Shiba Inu mimics Dogecoin’s double bottom recovery
Shiba Inu avoids a close below the critical support level at $0.00001220, marked by June's lowest closing (June 5) so far, despite increased pressure last week. After multiple long-tailed candles, SHIB is up by over 1% at press time on Monday, hinting at a trend reversal.
Similar to DOGE, Shiba Inu teases a double bottom pattern as it bounces off the $0.00001220 support with a neckline at $0.00001337, the highest closing price last week. A clean push in closing price above the neckline will mark the pattern breakout.
The similarity with DOGE extends to the momentum indicator as a bullish RSI divergence manifests in the daily chart. The RSI indicator at 40 shows a recovery approaching the halfway line, suggesting a gradual rise in bullish momentum.
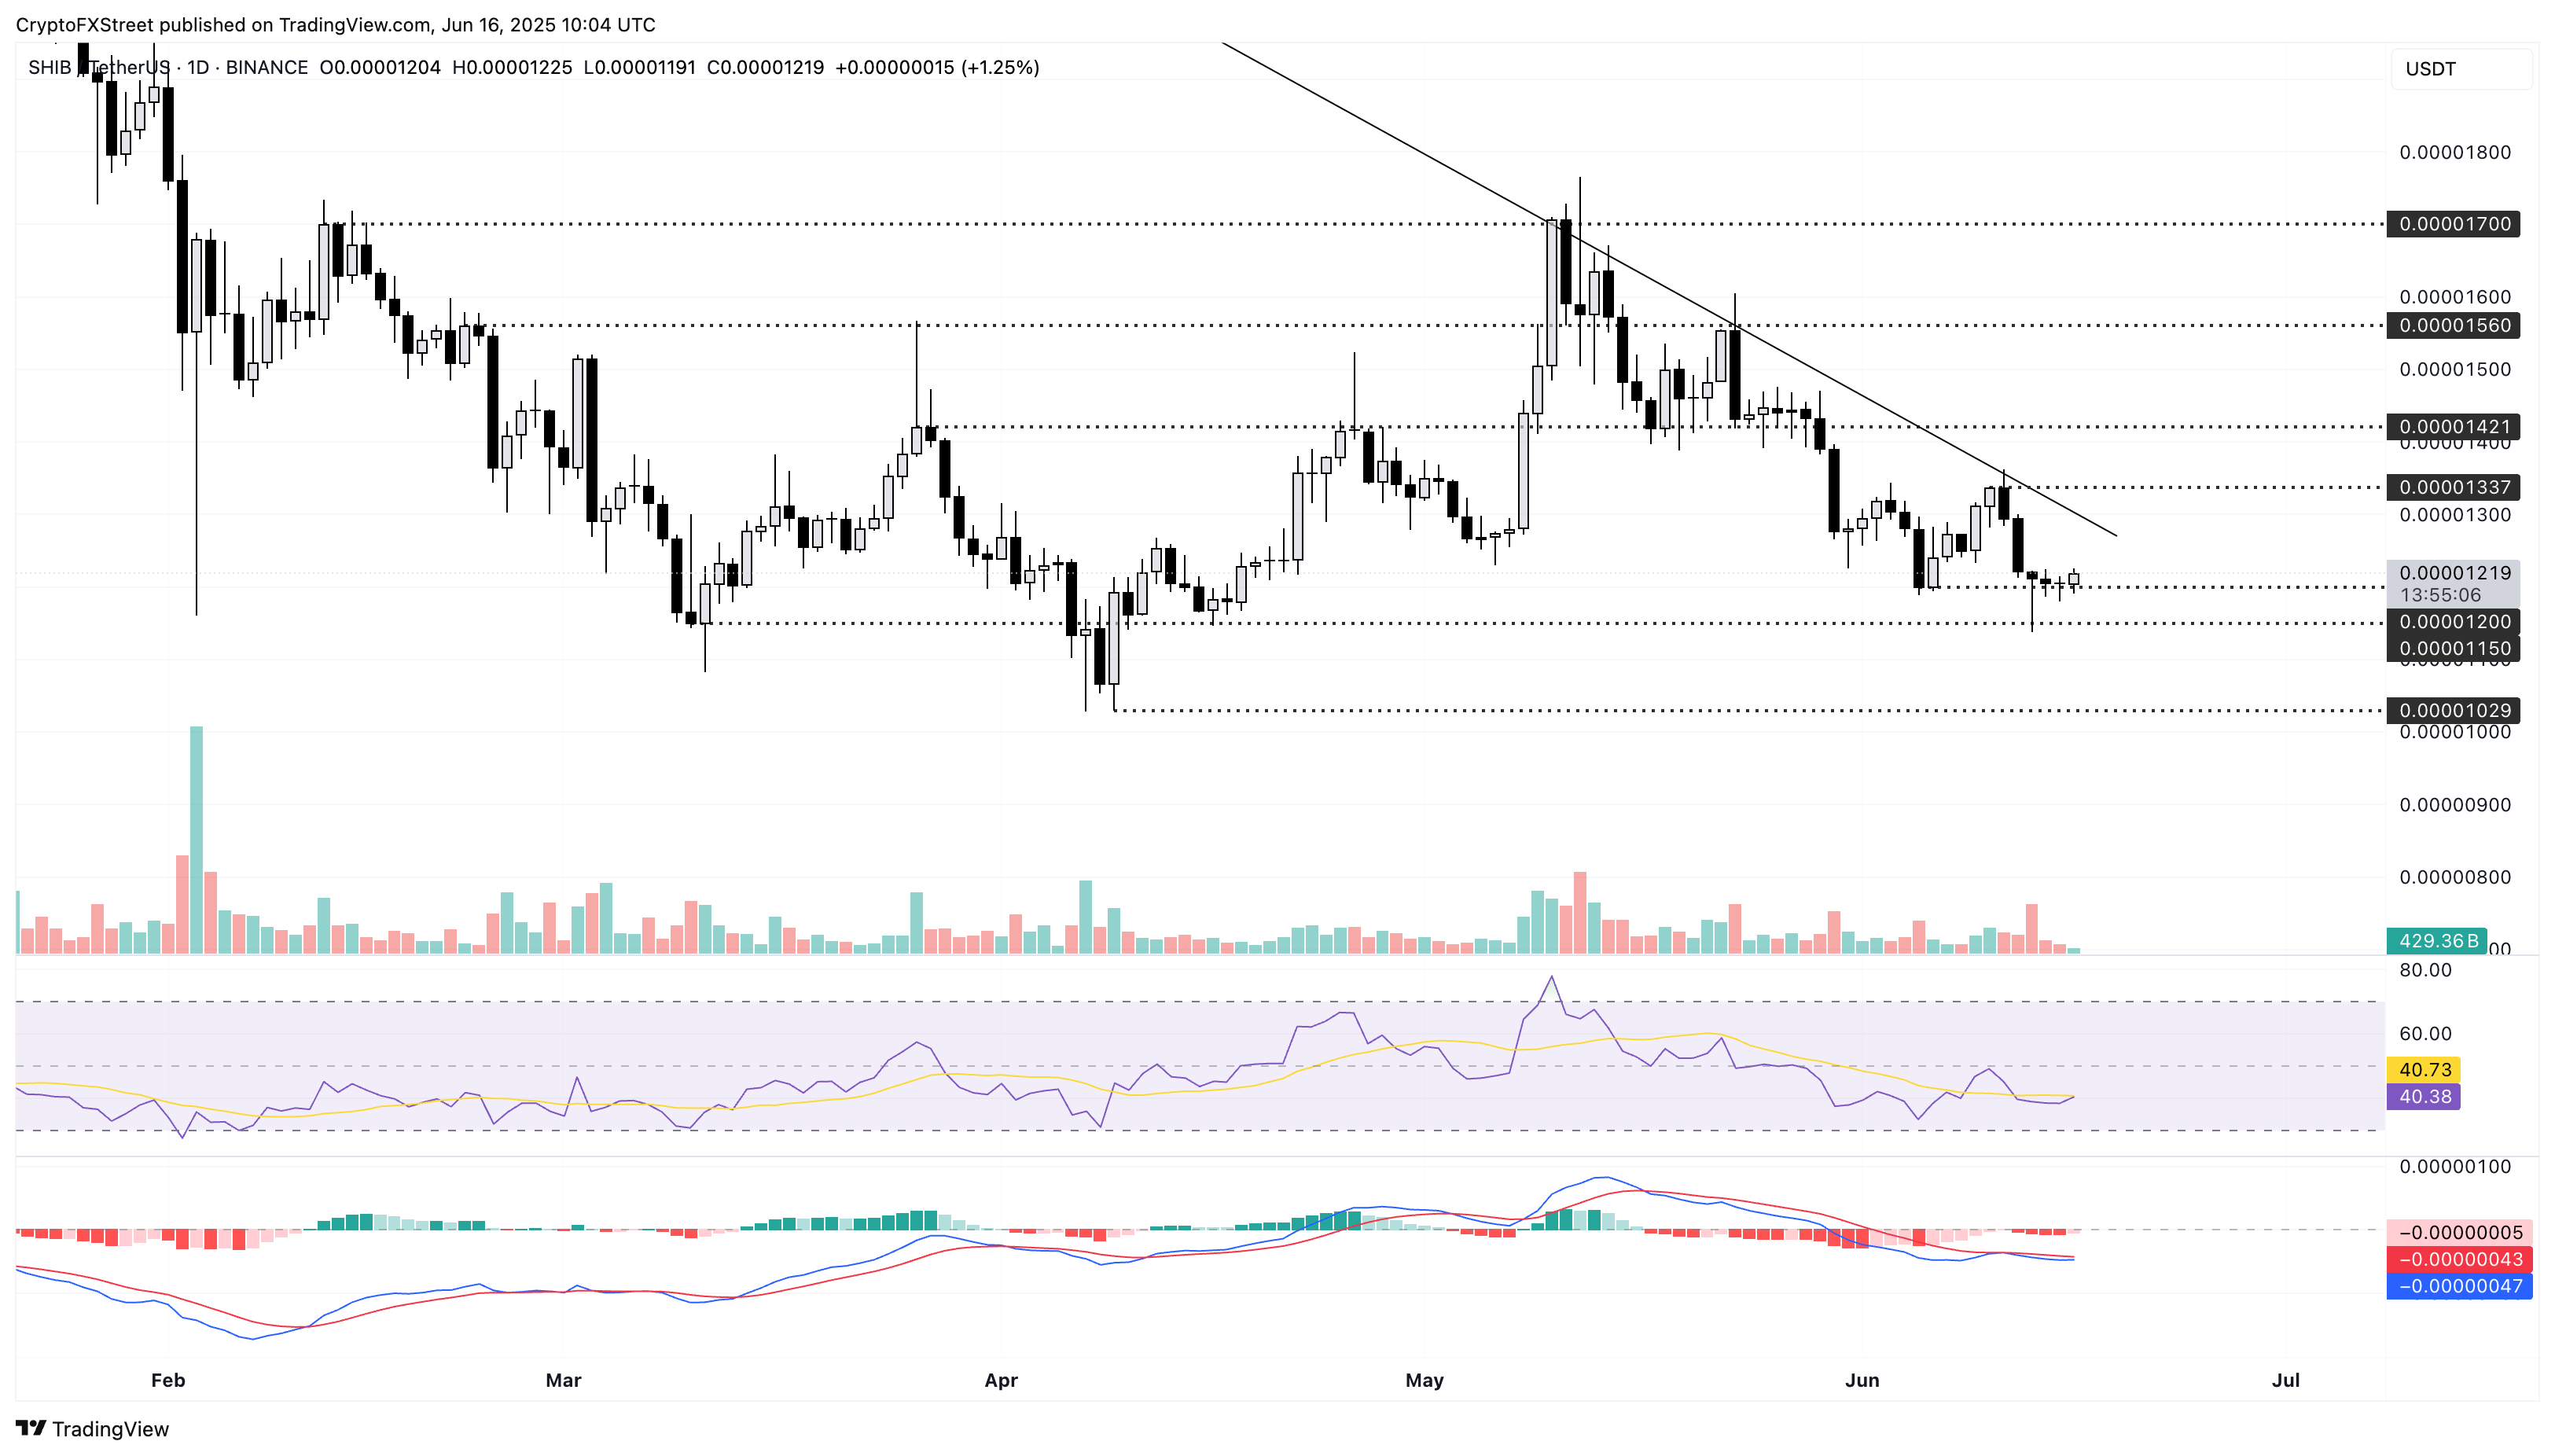
SHIB/USDT daily price chart.
However, a closing below the $0.00001220 support floor will nullify the bullish pattern. In such a case, SHIB could extend the correction to test the $0.00001150 level last tested on April 16.
Pepe recovery crosses key resistance
Pepe’s pullback last week bottomed out before risking a close below the $0.00001000 psychological support level. At the time of writing, PEPE trades at $0.00001139, with a nearly 10% surge from its Friday low of $0.00001044.
The recovery rally has crossed above the $0.00001119 resistance last tested by a reversal on Sunday on the 4-hour chart. With a clean closing price push above this key resistance, Pepe now targets the $0.00001208 resistance marked by a swing low on May 17.
The RSI indicator at 51 crosses above the halfway line, signalling a turn in momentum favouring bulls in the 4-hour chart. As RSI needs to cover space before reaching overbought conditions, the indicator projects room for growth in the PEPE price.
Further up, the Moving Average Convergence/Divergence (MACD) indicator crosses above its signal line, marking a bullish crossover. This aligns with the trend reversal thesis and backs upside chances.
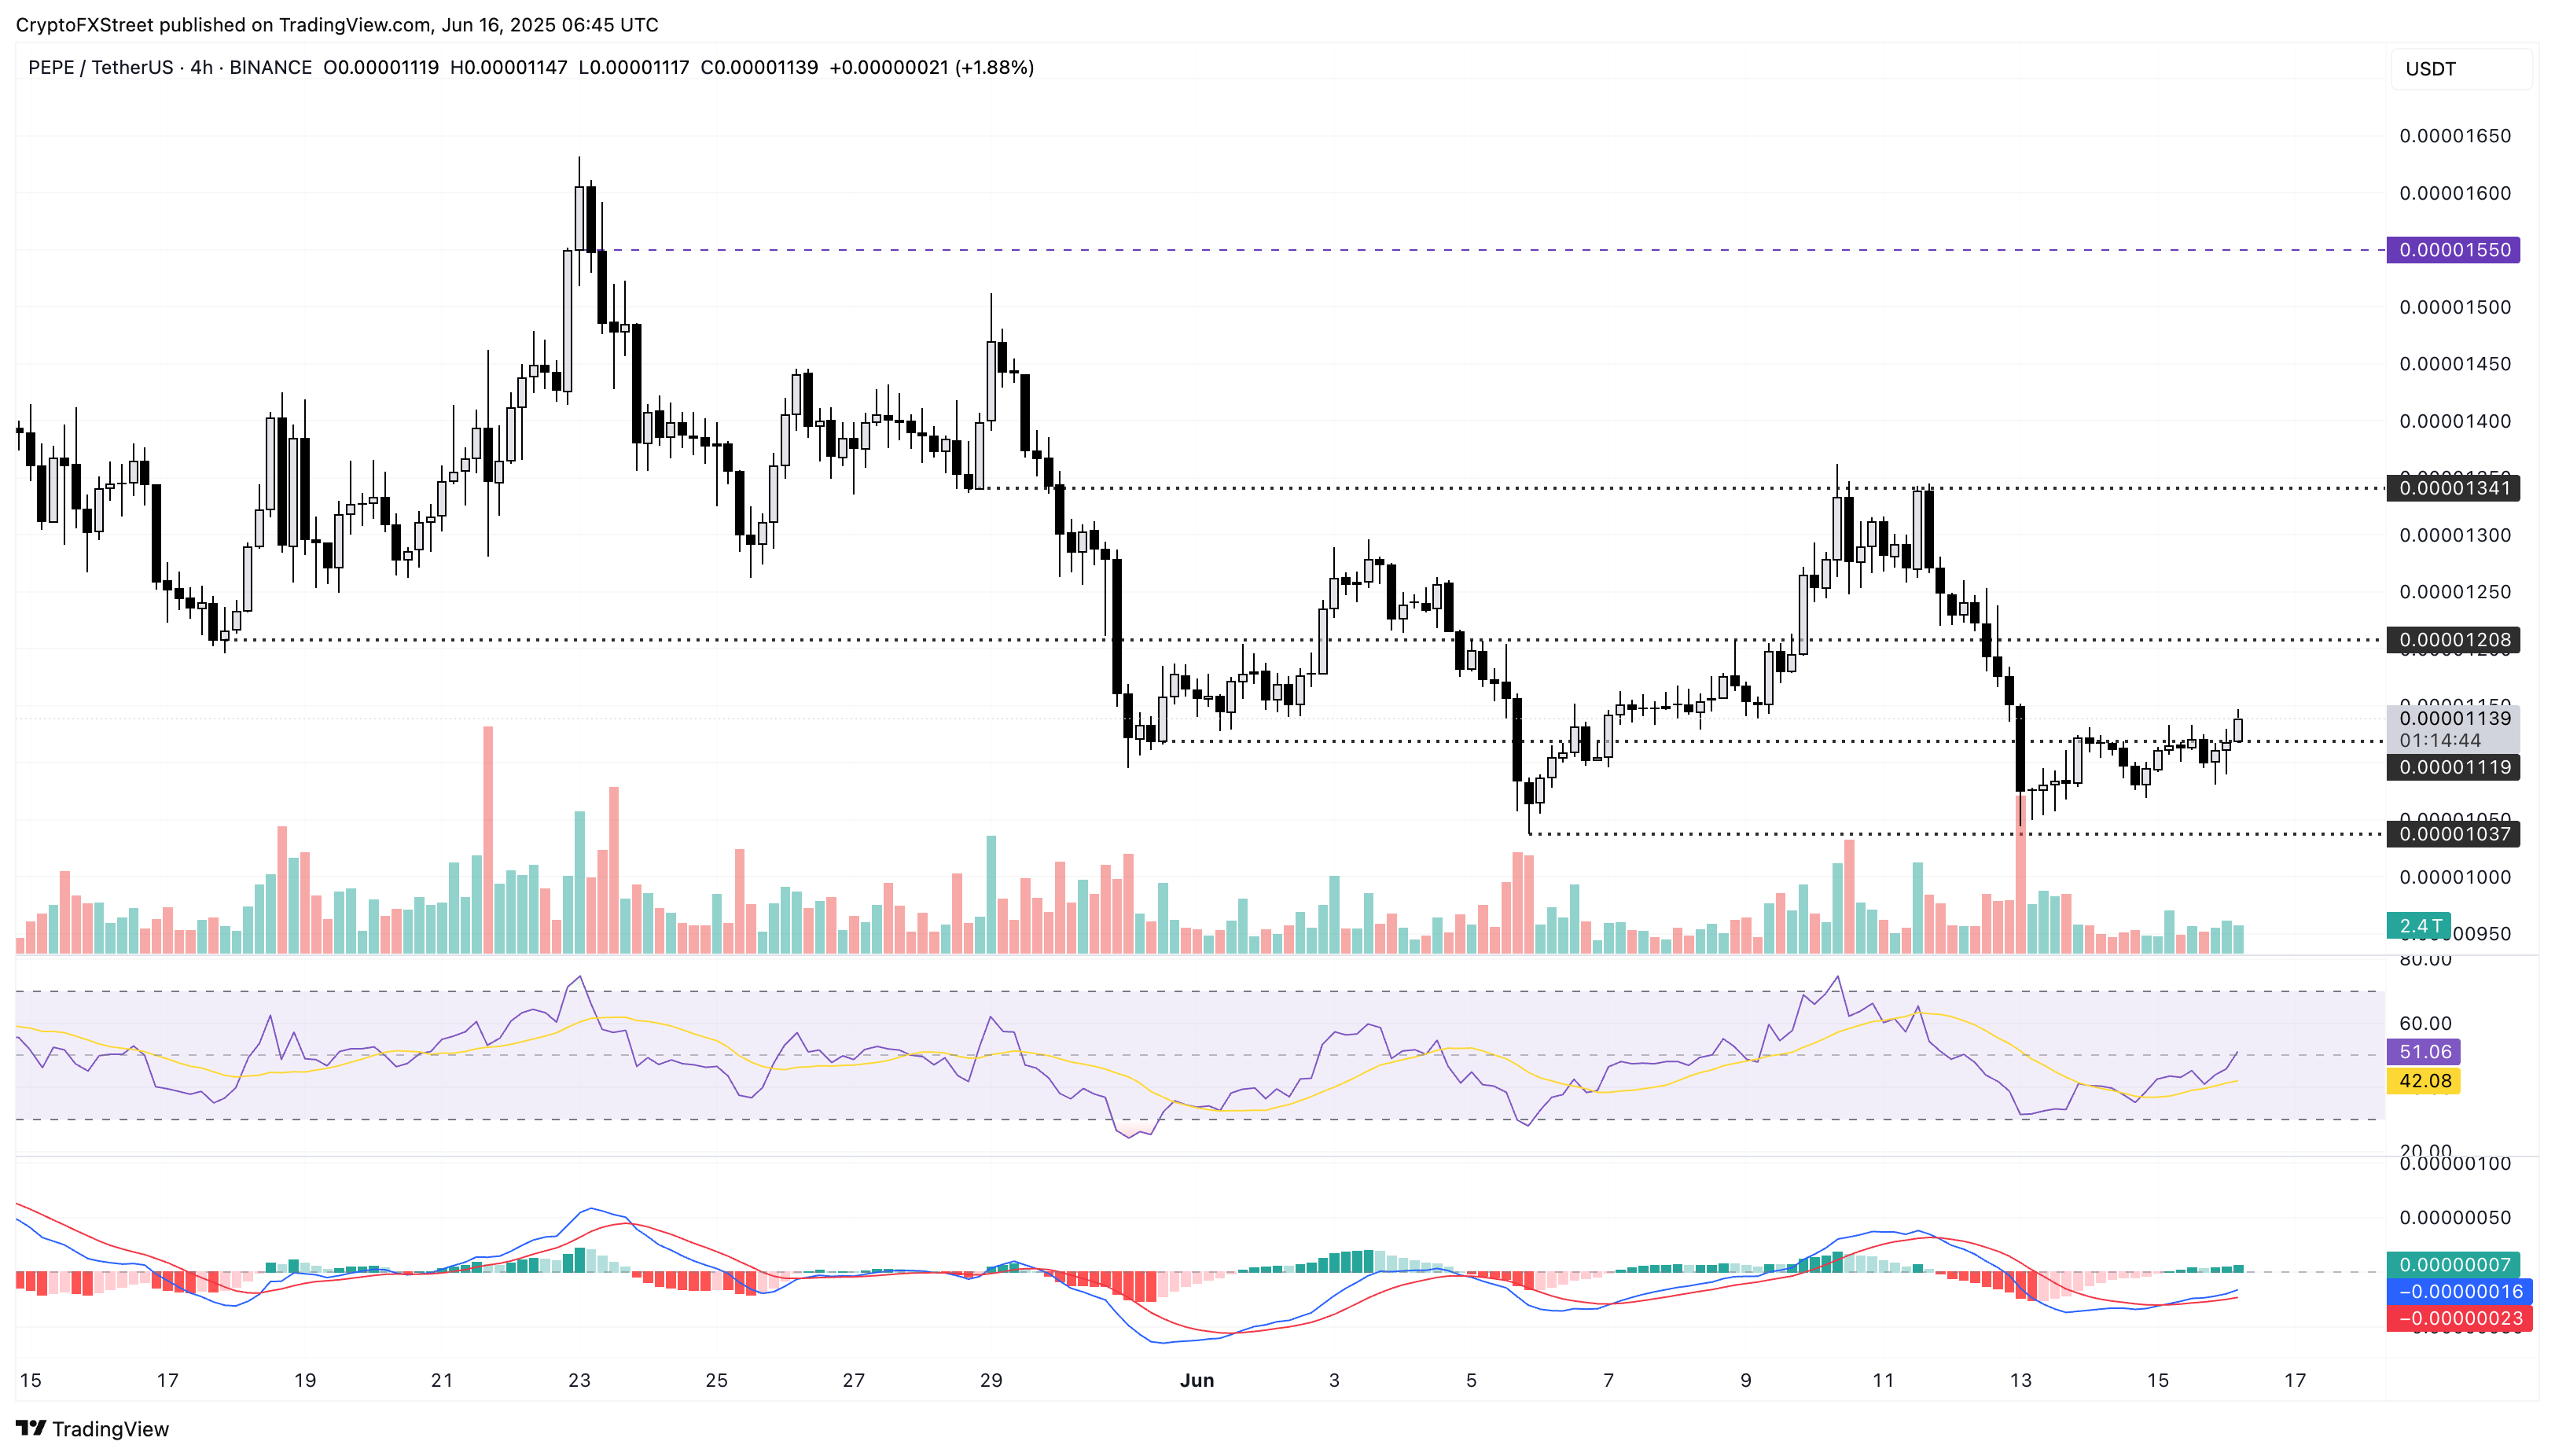
PEPE/USDT 4-hour price chart.
If Pepe fails to hold support at $0.00001119, a steeper correction towards $0.00001000 is possible.

Read more
* The content presented above, whether from a third party or not, is considered as general advice only. This article should not be construed as containing investment advice, investment recommendations, an offer of or solicitation for any transactions in financial instruments.


