


EUR/GBP Price Forecast: Euro bounces from 0.8737 lows with bears still in control
- The Euro picks up from 0.8737 lows against the Pound but is lac¡king acceptence above 0.8750.
- The pair remains on the defensive following a nearly 0.7% sell-off on Wednesday.
- Investors' relief on the UK budget and the upward revision of the UK's GDP have provided an additional impulse to the Pound.
The Euro is picking up from five-week lows near 0.8735 on Thursday, as the Pound loses steam, following Wednesday’s rally. The pair, however, maintains its bearish trend intact, with technical indicators pointing lower and investors upbeat about the details of the UK budget.
A combination of investors' relief amid the GBP 26 billion of annual tax rises contained in the UK’s budget to cover the fiscal deficit, the upwardly revised Gross Domestic Product (GDP) estimations for 2025, and solid UK services activity figures sent the GBP rallying across the board on Wednesday.
Technical Analysis: Support at 0.8737 remains on the bears’ focus
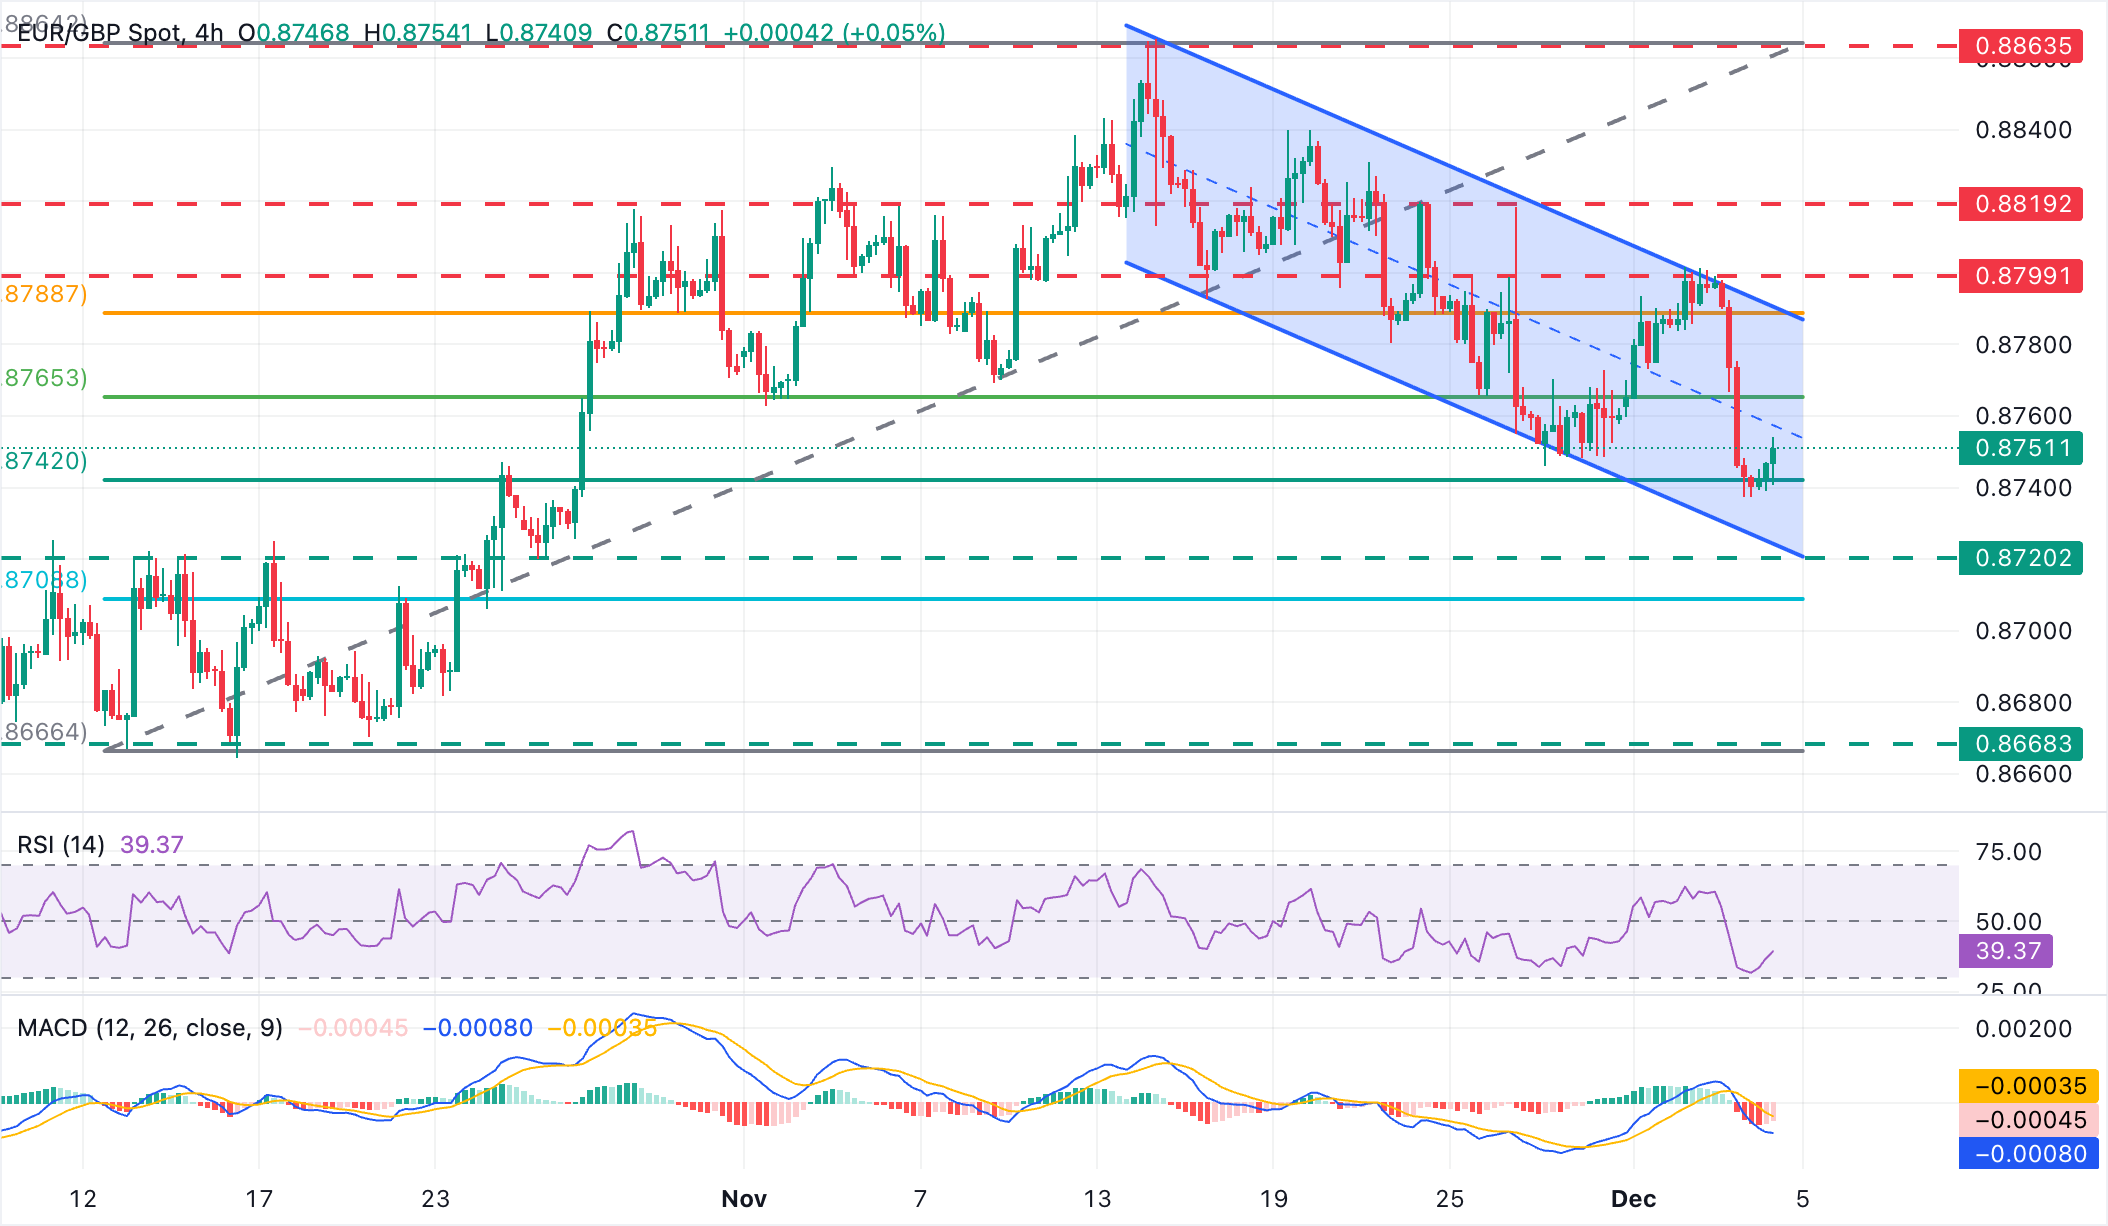
Technically, the pair keeps trading within the bearish channel from mid-November highs, with upside attempts likely to be corrective. The 4-hour Relative Strength Index (RSI) remains below 40, and the Moving Average Convergence Divergence (MACD) is trending lower at levels below zero, signalling a moderate bearish momentum.
The pair attempts to bounce up from the 61.8% Fibonacci retracement of the October-November rally, near 0.8740, although bulls are struggling to find acceptance above 0.8750. Key resistances are at the top of the channel, now at 0.8785, and the December 2 and 3 highs, in the area of 0.8800.
On the downside, Wednesday’s low at 0.8737 remains at a short distance. Further down, the targets are the October 27 low, at 0.8720 and the 78.2 Fibonacci retracement, near 0.8710.
Pound Sterling Price This week
The table below shows the percentage change of British Pound (GBP) against listed major currencies this week. British Pound was the strongest against the US Dollar.
| USD | EUR | GBP | JPY | CAD | AUD | NZD | CHF | |
|---|---|---|---|---|---|---|---|---|
| USD | -0.69% | -0.80% | -0.77% | -0.13% | -1.03% | -0.75% | -0.44% | |
| EUR | 0.69% | -0.10% | -0.11% | 0.57% | -0.34% | -0.07% | 0.25% | |
| GBP | 0.80% | 0.10% | 0.25% | 0.67% | -0.24% | 0.04% | 0.36% | |
| JPY | 0.77% | 0.11% | -0.25% | 0.66% | -0.25% | 0.03% | 0.34% | |
| CAD | 0.13% | -0.57% | -0.67% | -0.66% | -0.94% | -0.61% | -0.31% | |
| AUD | 1.03% | 0.34% | 0.24% | 0.25% | 0.94% | 0.27% | 0.59% | |
| NZD | 0.75% | 0.07% | -0.04% | -0.03% | 0.61% | -0.27% | 0.32% | |
| CHF | 0.44% | -0.25% | -0.36% | -0.34% | 0.31% | -0.59% | -0.32% |
The heat map shows percentage changes of major currencies against each other. The base currency is picked from the left column, while the quote currency is picked from the top row. For example, if you pick the British Pound from the left column and move along the horizontal line to the US Dollar, the percentage change displayed in the box will represent GBP (base)/USD (quote).
Recommended Articles


