

ADA Price Struggles To Break Above Trendline – Downward Trend Persists

- Gold Price Forecast: Gold Poised to Break $4,200 as Oil Price Slump Eases Inflation Fears
- Gold Price Forecast: Oil Price Breaking $100 Fuels Inflation Concerns, Will Gold Prices Fall Further?
- Gold rallies to over two-week high, eyes $4,150 as traders track US-Iran diplomacy efforts
- Middle East War updates: US-Iran pause strikes as Trump weighs up diplomatic options
- WTI climbs above $87.00 as Middle East conflict threatens key choke points
- Today’s Market Recap: Oil Breaks $100, Fueling Inflation Fears, as AI Capex Faces Scrutiny and Tesla’s 14% Plunge Drags Down Tech Sector

ADA is the native cryptocurrency of the Cardano blockchain network, which is used for transactions, staking, and as a means of participating in the platform’s governance. Recently, the price of ADA has been on a downtrend, and from the look of things the token is not showing any sign of reversing anytime soon.
ADA On The 4-Hour Chart
As of the time of writing, ADA’s price has dropped by over 30% from its previous high of $0.8107. The crypto asset is currently trading around $0.4604 and about 0.65% down in the last 24 hours.
Trendline And 100-Day Moving Average (MA): Using the 4-day timeframe, ADA has failed to cross over the trend, allowing the price to move further downward. If the price continues to move downward, it might break out from its previous low of $0.4000 and create a new low.
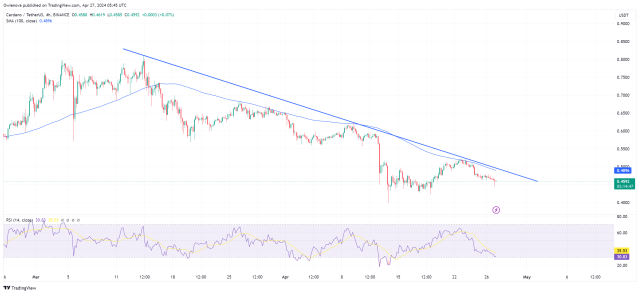
The price of ADA is also seen trending below the 100-day Simple Moving Average (SMA) after a successful crossing over at $0.5966, suggesting the continuous decline of the price.
Relative Strength Index (RSI): The 4-day RSI also shows that the price is still on a downtrend as the RSI signal line is still trending below the 50% level. Although the RSI signal line is in the oversold zone, there is still a possibility that the price could continue to drop.
Movement On The 1-Day Chart
Trendline And 100-Day MA: The digital asset in the 1-day timeframe continues to trend below the 100-day simple moving average and the trendline, after the failure to break above these lines.
Meanwhile, the RSI also confirms that the price is on a downtrend as the RSI signal line is trending below the 50% level and could continue to move downward for a while.
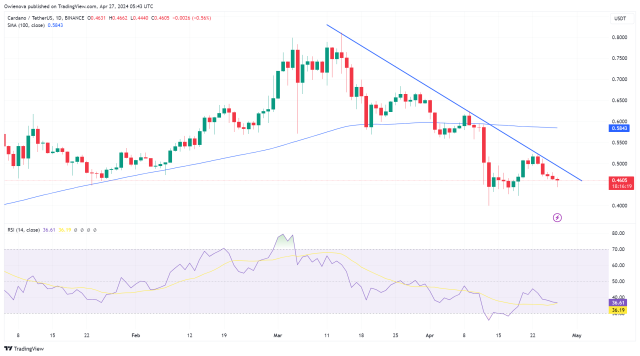
In conclusion, since ADA failed to break above the 100-day SMA and the trendline, if it continues to move downward and manages to break below its previous low of $0.4255, it might move even further toward its support level of $0.4000. On the contrary, if the price fails to move below these lows, it might start an upward movement toward its previous resistance level of $0.5243, If it manages to break above this level, the price might continue to move upward to start a new trend in the direction.
Read more
* The content presented above, whether from a third party or not, is considered as general advice only. This article should not be construed as containing investment advice, investment recommendations, an offer of or solicitation for any transactions in financial instruments.


