

Chainlink (LINK) Price Breaks $11 Post-Fed Rate Cut: What’s Next

- Gold Price Forecast: Oil Price Breaking $100 Fuels Inflation Concerns, Will Gold Prices Fall Further?
- Gold Price Trend Forecast: Expectations of Easing US-Iran Tensions Boost Gold Prices, $4,070 Becomes Key Level for Bulls and Bears
- Gold rallies to over two-week high, eyes $4,150 as traders track US-Iran diplomacy efforts
- Euro declines to near 1.1400 as US launches fresh strikes on Iran
- Tesla Q2 Earnings Preview: Record Deliveries Fail to Hide Profit Pressure, Can Musk Rely on AI and Autonomous Driving to Unlock New Growth Space?
- WTI climbs above $87.00 as Middle East conflict threatens key choke points
Chainlink’s (LINK) price has risen above $11 following the recent Fed rate cut. This increase has ignited fresh speculation about the coin’s short-term outlook.
In this analysis, BeInCrypto examines the factors contributing to the hike, the potential implications of the rate cut, and what traders can expect from LINK.
Chainlink Key Drivers Want More
According to Santiment, alongside the recent rate cut, Chainlink’s 90-day Mean Coin Age (MCA) has risen. The MCA reflects the average age of tokens in circulation, with a low MCA suggesting that previously inactive tokens are being moved from cold wallets, potentially leading to a sell-off and putting downward pressure on the price.
Conversely, a rising MCA indicates that investors are holding onto their tokens and engaging less in trading activity, often signaling a long-term hold strategy. In Chainlink’s case, the spike in the MCA suggests that many investors are choosing to keep their LINK tokens dormant or moving them into self-custody, reducing selling pressure.
Read more: How To Buy Chainlink (LINK) and Everything You Need To Know
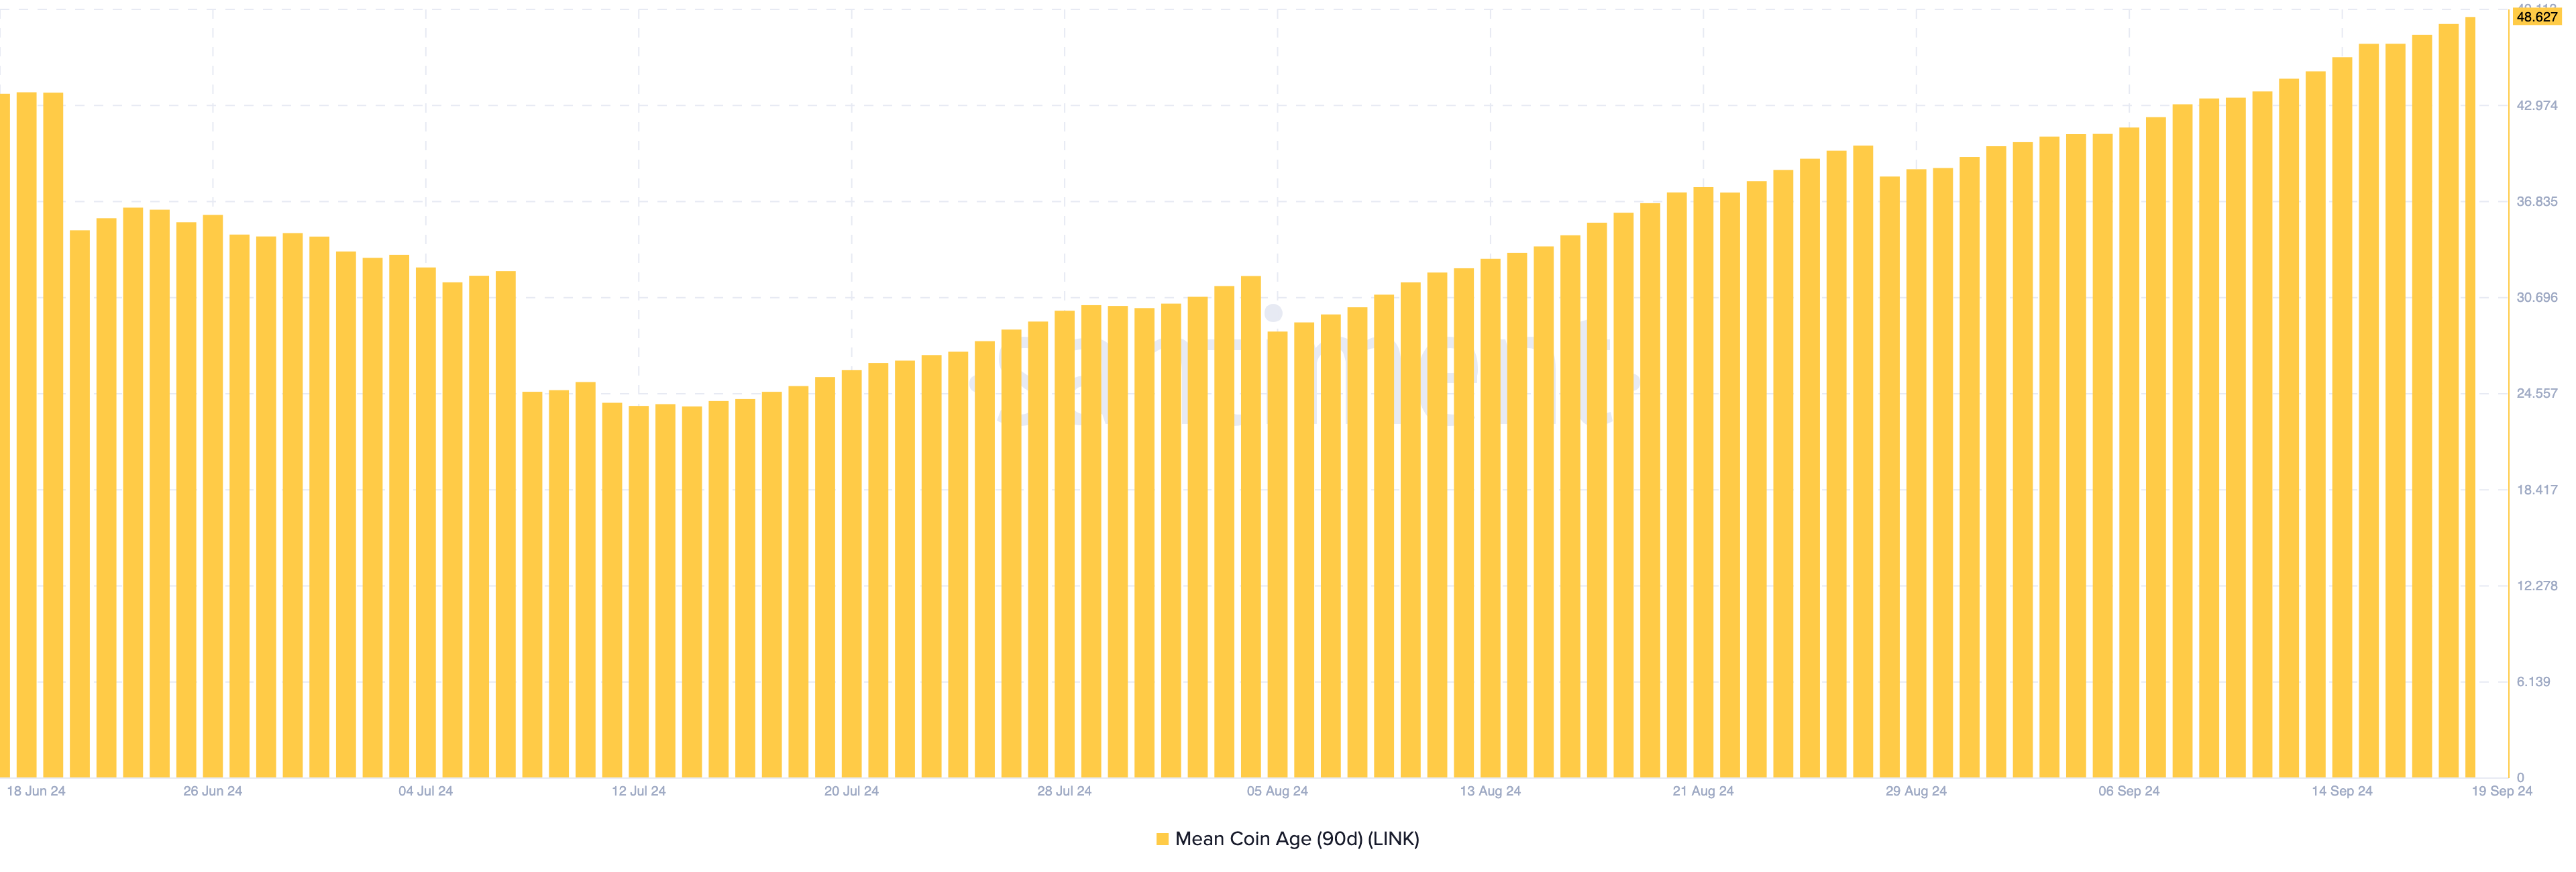 Chainlink 90-Day Mean Coin Age. Source: Santiment
Beyond the rising coin age, the 4-hour LINK/USD chart reveals a surge in the Cumulative Volume Delta (CVD), a key indicator of market sentiment. Each bar on the CVD shows whether the market is dominated by buying or selling activity. Red bars signal selling pressure, which could drive the price down.
In LINK’s case, the chart shows five consecutive green bars, indicating sustained buying pressure. This suggests that the market’s demand for LINK is growing, potentially supporting the continuation of its uptrend.
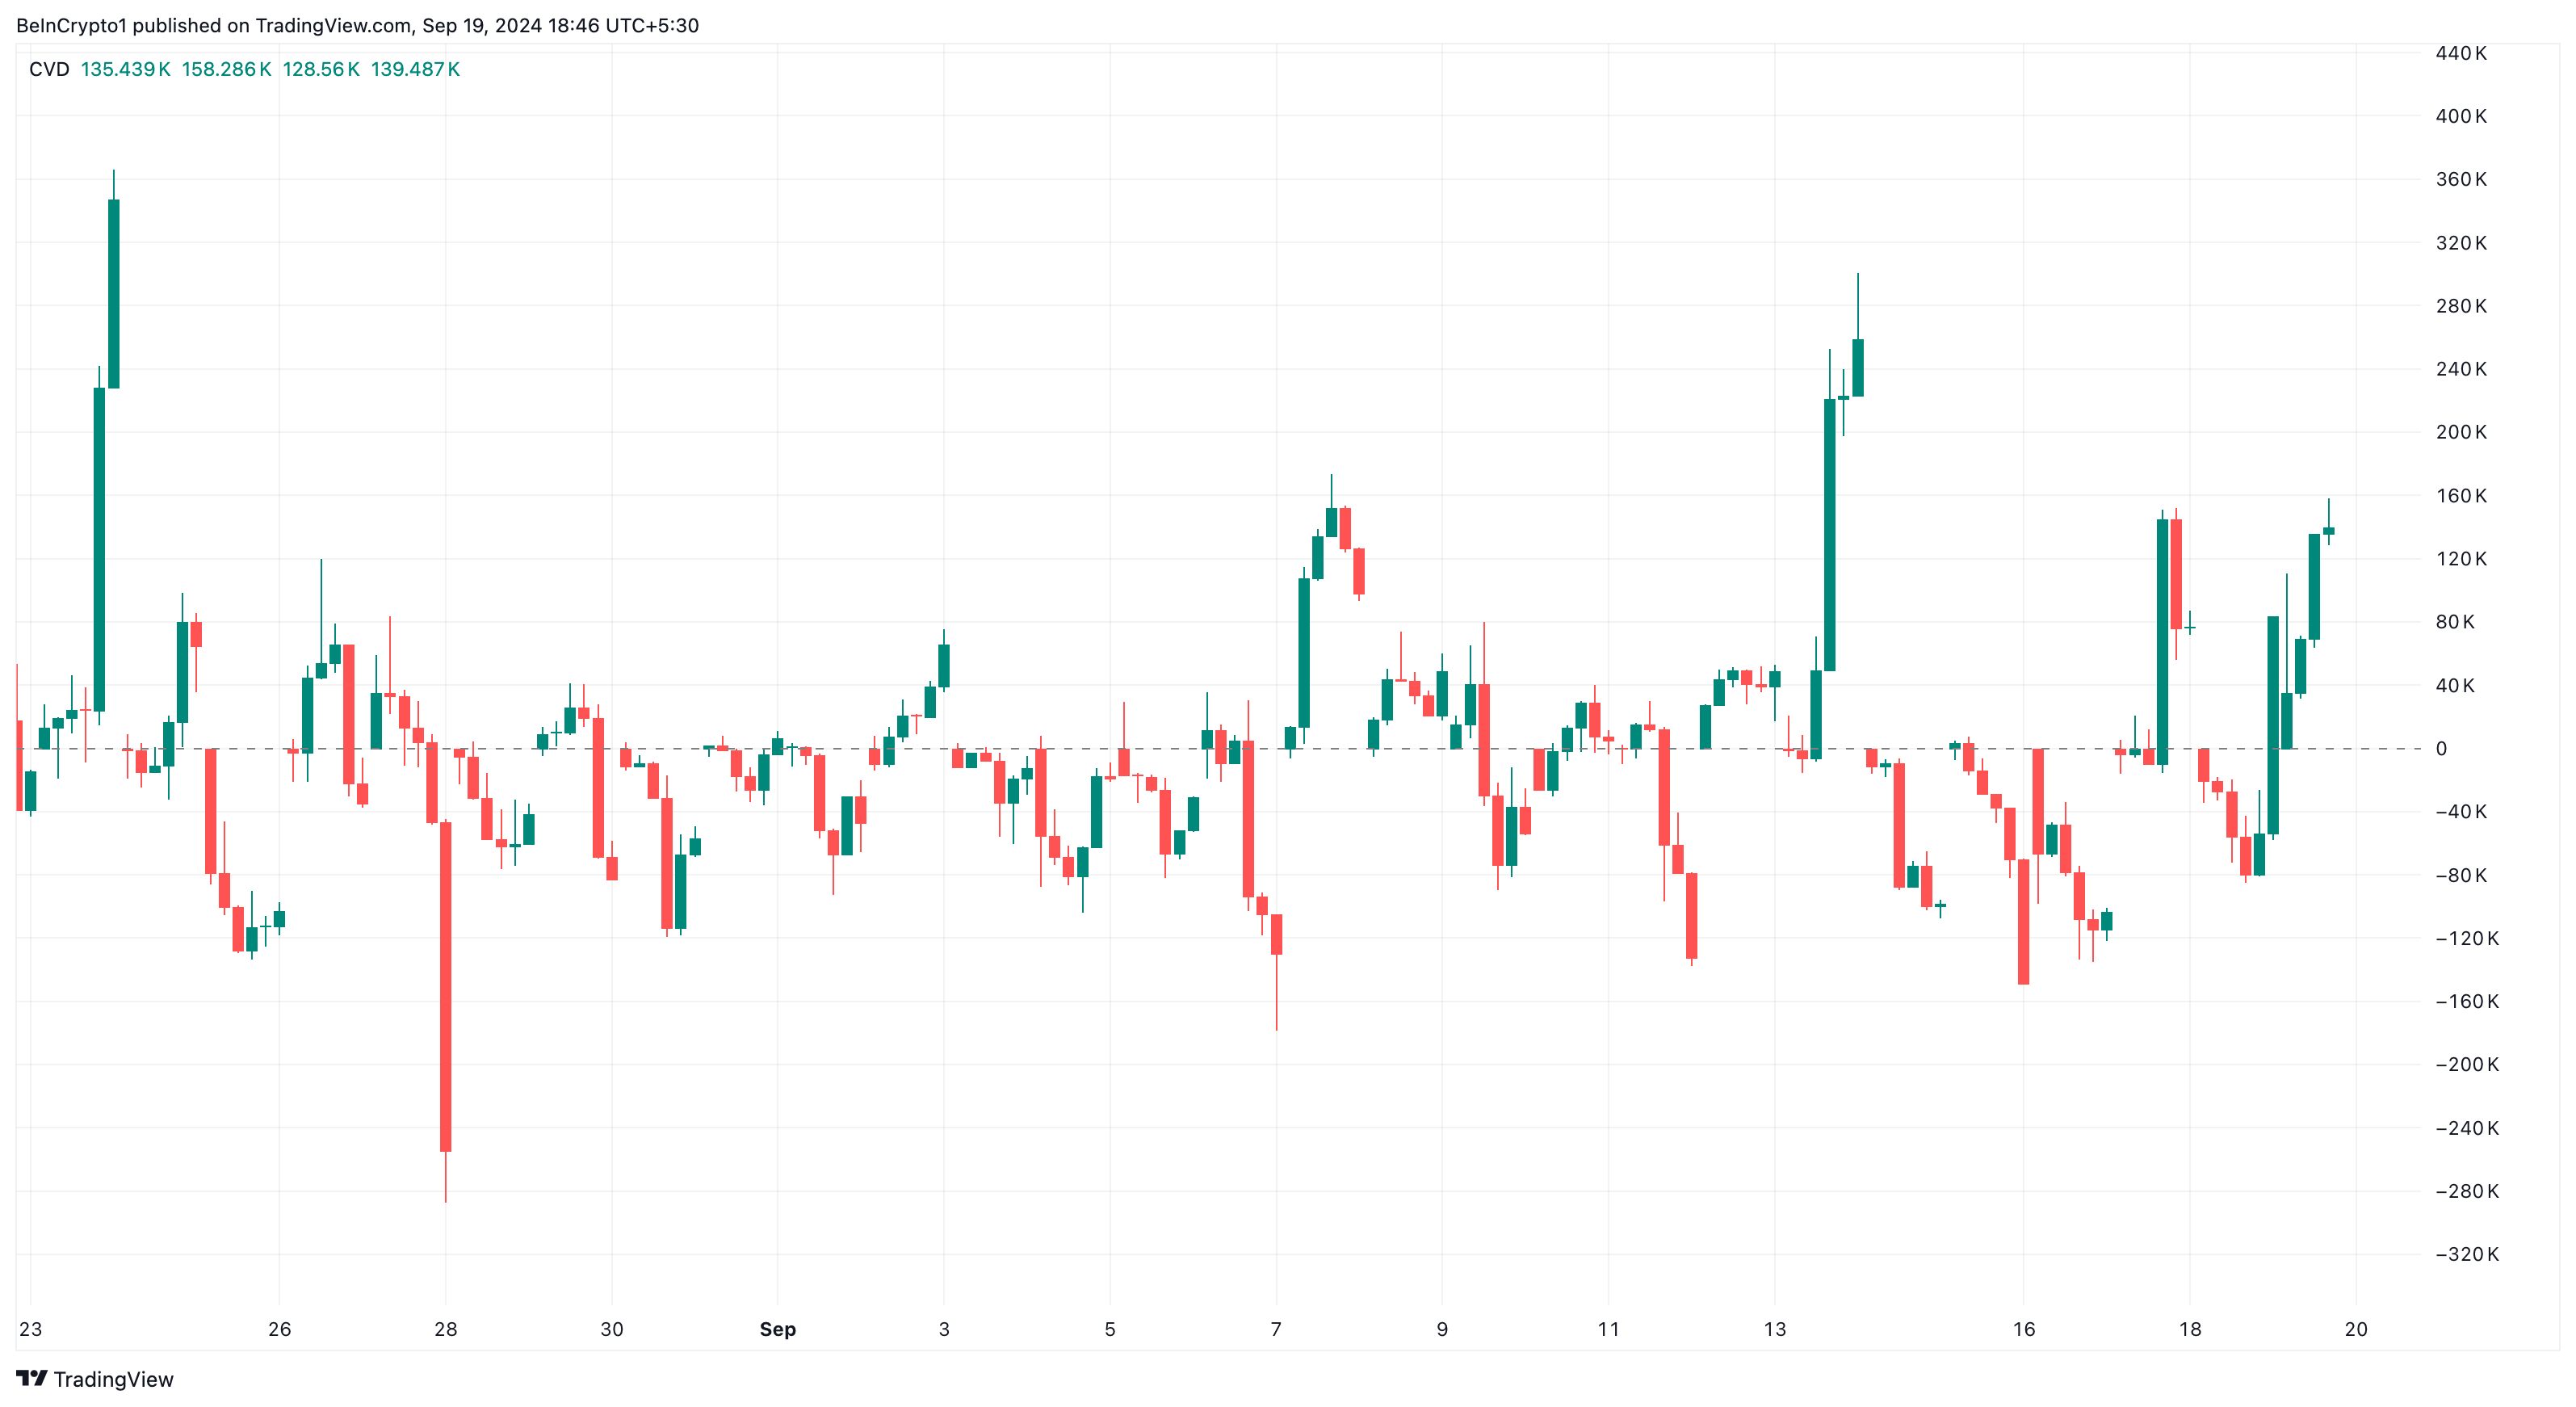 Chainlink Cumulative Volume Delta. Source: TradingView
LINK Price Prediction: Further Gains
The daily chart shows that Chainlink is holding strong at the $10.02 support level, which played a key role in its recent breakout above the $10.83 resistance. Currently, LINK is trading at $11.30, with no significant resistance in sight to halt the uptrend.
Using Fibonacci retracement levels to assess potential price targets, LINK’s next likely move could take it to $11.86, corresponding to the 38.2% Fibonacci level. If it breaks past this point, the next target could be around $12.98, a level that appears within reach given the current momentum.
Read more: Chainlink (LINK) Price Prediction 2024/2025/2030
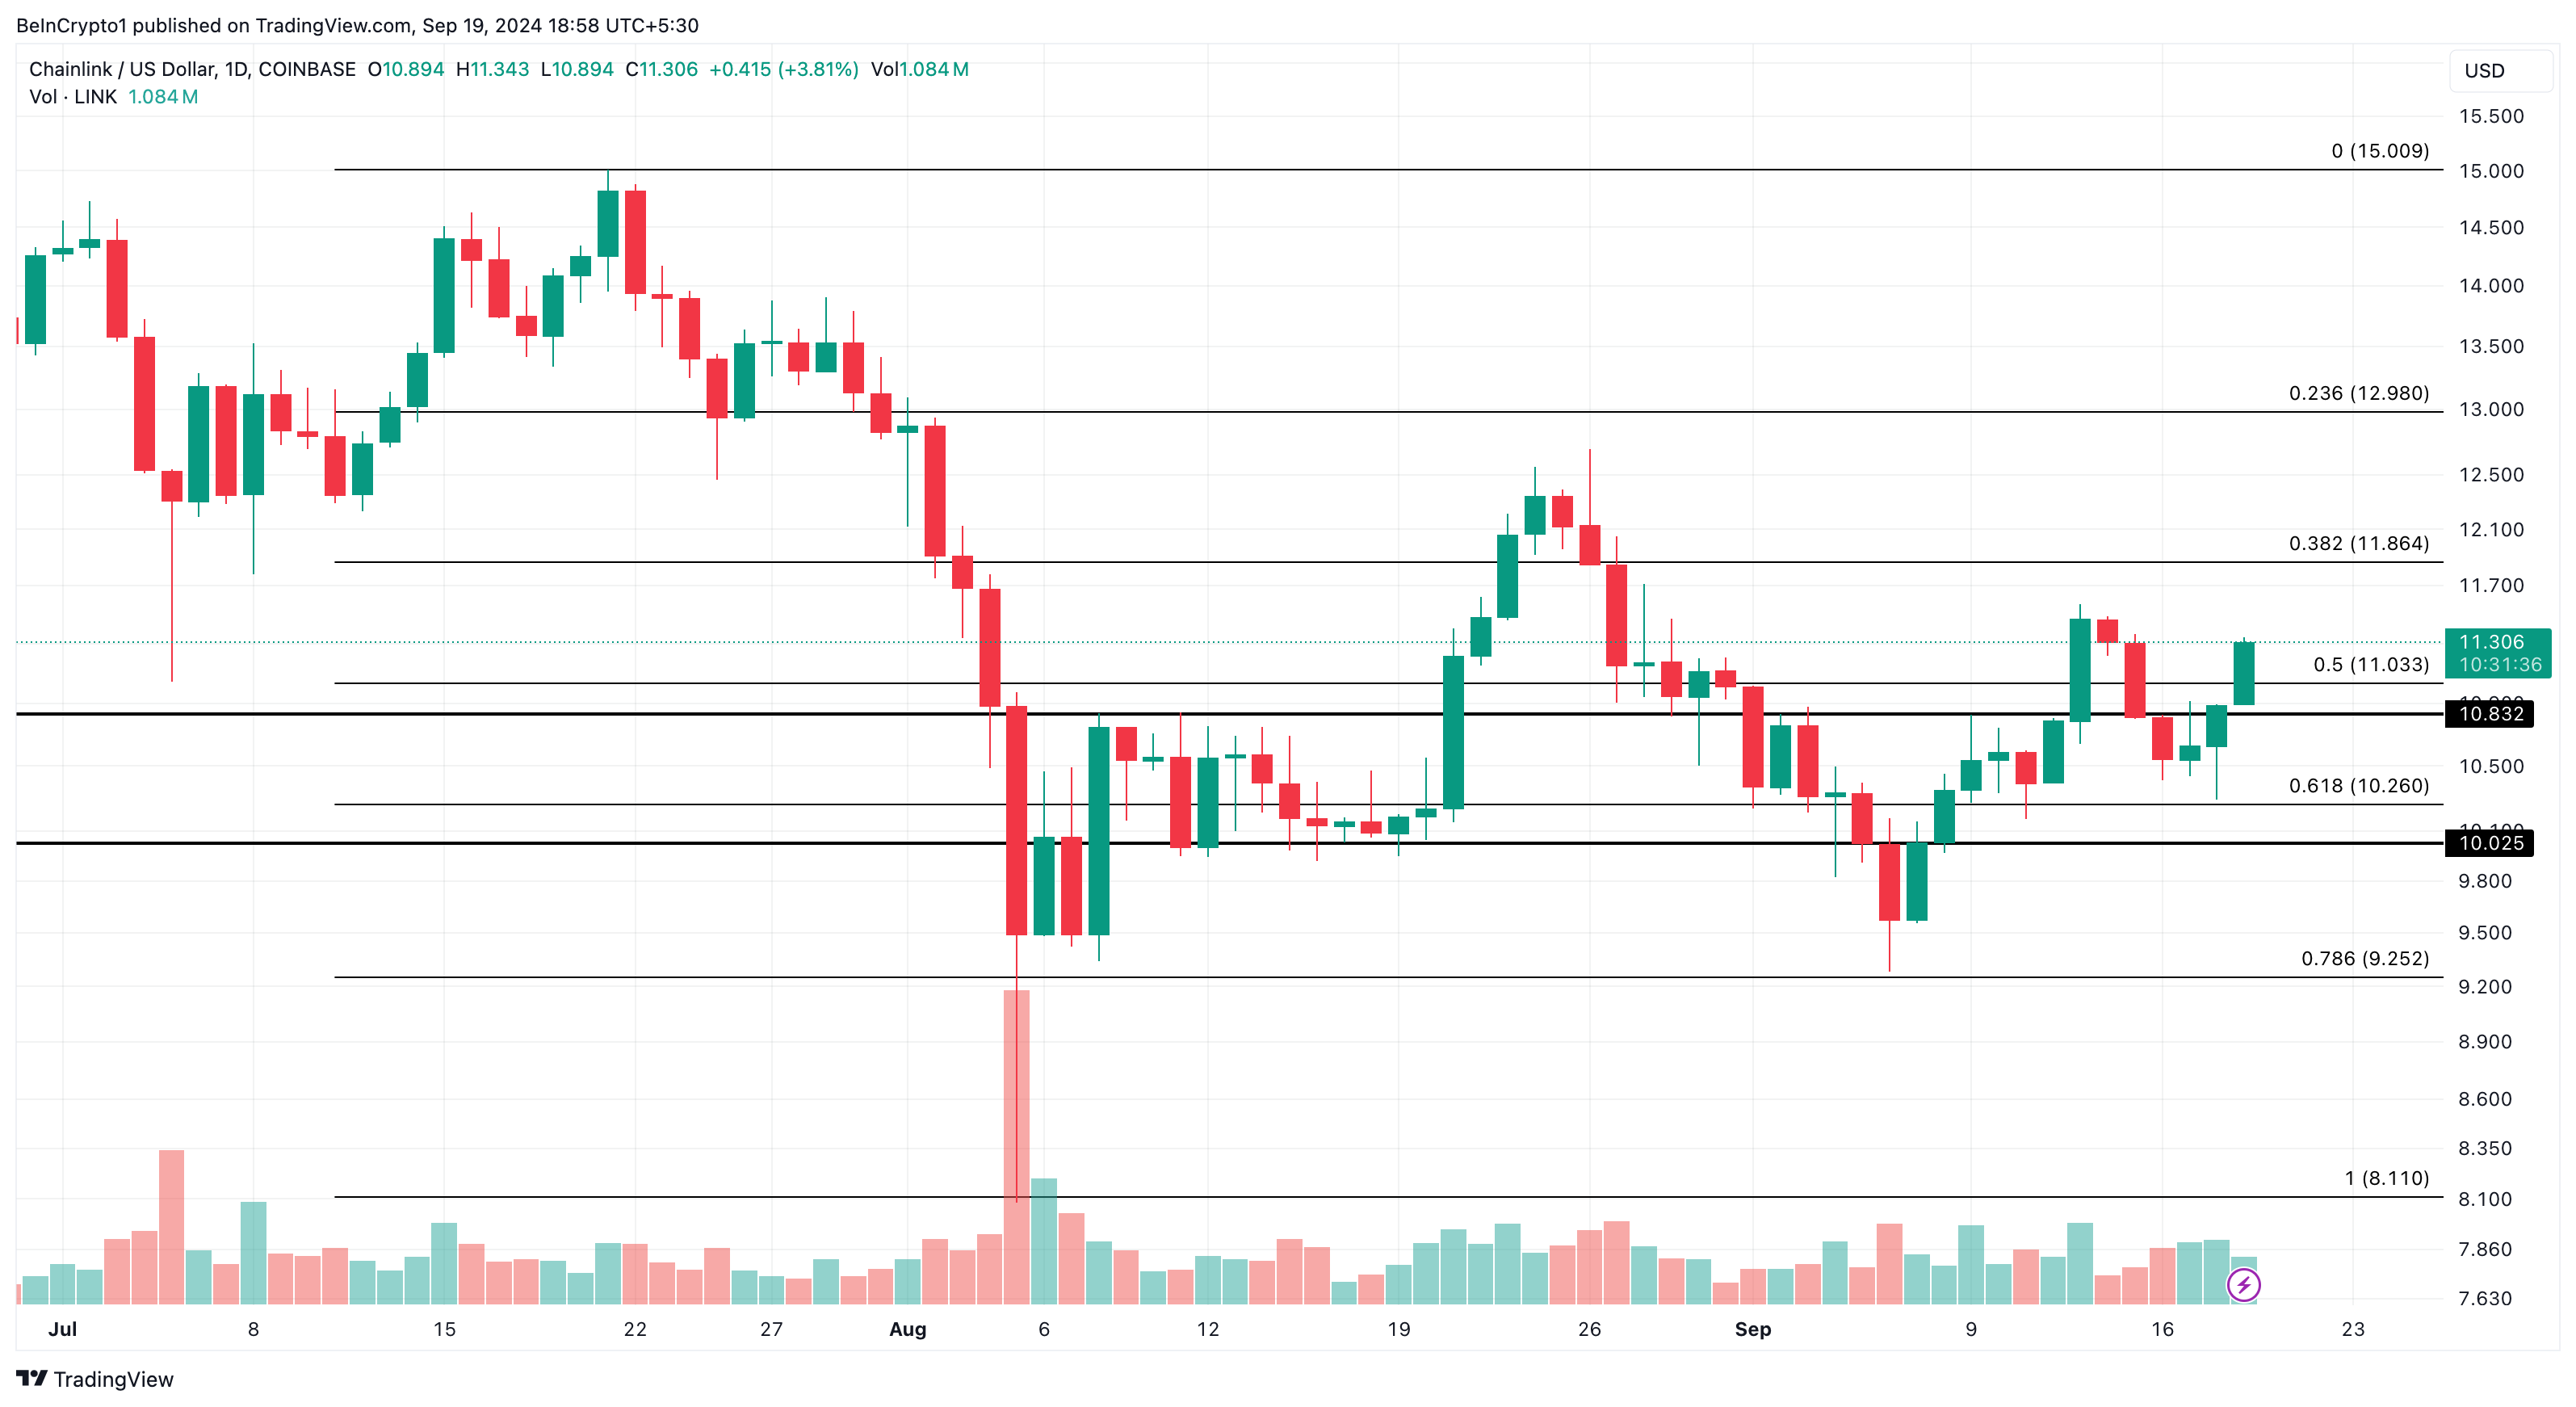 Chainlink Daily Analysis. Source: TradingView
However, the cryptocurrency could experience a pullback if it fails to surpass $11.86. If that happens, LINK might drop to $9.25.
Read more
* The content presented above, whether from a third party or not, is considered as general advice only. This article should not be construed as containing investment advice, investment recommendations, an offer of or solicitation for any transactions in financial instruments.


