

Ethereum Price Dips: Healthy Cooldown or Warning Sign of Bigger Trouble?

- Gold slumps below $4,800 on renewed Strait of Hormuz tensions
- How Will the U.S.-Iran Situation Evolve? What Is Behind the Nasdaq’s Record High?
- Gold holds steady above $4,800 amid US-Iran ceasefire uncertainty
- JPMorgan Raises S&P 500 Target; Can AI Sector Continue to Drive US Stocks?
- Australian Dollar receives support after Trump extends ceasefire with Iran
- WTI drifts higher to near $89.00 amid Lebanon-Israel ceasefire strains

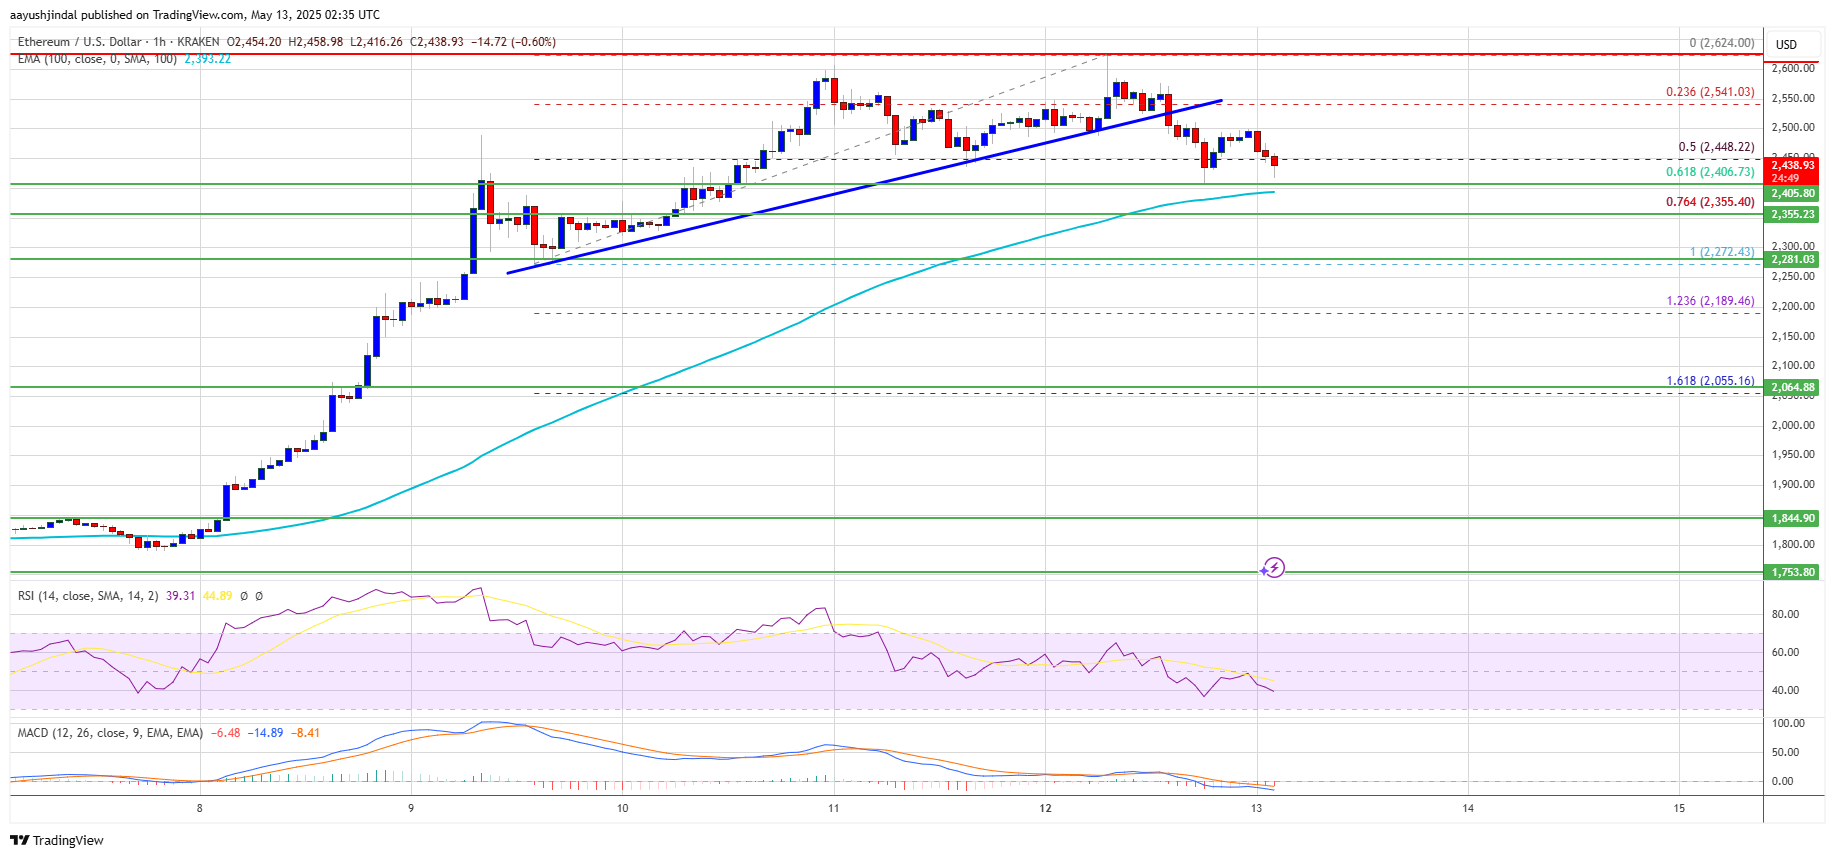
Ethereum price extended its increase above the $2,500 zone. ETH is now correcting gains and might revisit the $2,350 support zone.
Ethereum started a downside correction from the $2,600 resistance.
The price is trading above $2,400 and the 100-hourly Simple Moving Average.
There was a break below a connecting bullish trend line with support at $2,500 on the hourly chart of ETH/USD (data feed via Kraken).
The pair could find bids near $2,350 and start a fresh increase in the near term.
Ethereum Price Aims Fresh Increase
Ethereum price remained supported and started a fresh increase above $2,350, beating Bitcoin. ETH gained pace for a move above the $2,400 resistance zone.
The bulls were able to push the price above the $2,550 resistance zone. The price gained over 35% and recently tested the $2,600 resistance zone. A high was formed at $2,624 and the price is now correcting gains. There was a minor decline below the 50% Fib retracement level of the upward move from the $2,272 swing low to the $2,624 high.
There was a break below a connecting bullish trend line with support at $2,500 on the hourly chart of ETH/USD. However, the bulls are still active above $2,400. Ethereum price is now trading above $2,400 and the 100-hourly Simple Moving Average.
On the upside, the price seems to be facing hurdles near the $2,500 level. The next key resistance is near the $2,550 level. The first major resistance is near the $2,620 level. A clear move above the $2,620 resistance might send the price toward the $2,650 resistance.
An upside break above the $2,650 resistance might call for more gains in the coming sessions. In the stated case, Ether could rise toward the $2,720 resistance zone or even $2,780 in the near term.
More Losses In ETH?
If Ethereum fails to clear the $2,500 resistance, it could start a fresh downside correction. Initial support on the downside is near the $2,400 level. The first major support sits near the $2,350 zone and the 76.4% Fib retracement level of the upward move from the $2,272 swing low to the $2,624 high.
A clear move below the $2,350 support might push the price toward the $2,275 support. Any more losses might send the price toward the $2,220 support level in the near term. The next key support sits at $2,200.
Technical Indicators
Hourly MACD – The MACD for ETH/USD is losing momentum in the bullish zone.
Hourly RSI – The RSI for ETH/USD is now below the 50 zone.
Major Support Level – $2,350
Major Resistance Level – $2,500
Read more
* The content presented above, whether from a third party or not, is considered as general advice only. This article should not be construed as containing investment advice, investment recommendations, an offer of or solicitation for any transactions in financial instruments.


