


Ethereum (ETH) had one of its worst days of the year on Monday, August 5, as the price experienced a steep 23% correction. The result of this infamous decline was a drop to $2,120 — a level it last reached in 2023.
However, while ETH has quickly recovered, the initial plunge likely marked the bottom, and here’s why.
Ethereum On-Chain Signals Points to Major Upswing
From an on-chain perspective, Ethereum’s Market Value to Realized Value (MVRV) Z—Z-Score is down to 0.52. This entry-adjusted metric tells whether a cryptocurrency’s price is undervalued or overvalued relative to its fair value.
In other words, the MVRV Z-Score can also help spot market tops and bottoms. Historically, once the score is above 2.20, the price is close to the top of the cycle. For example, in 2021, when ETH’s price reached $4,819, this metric was 3.35.
Two months later, the price dropped to $2,440. In March, the metric reached 2.34 when ETH traded around $4,067. Since then, the altcoin has not tested the $4,000 mark.
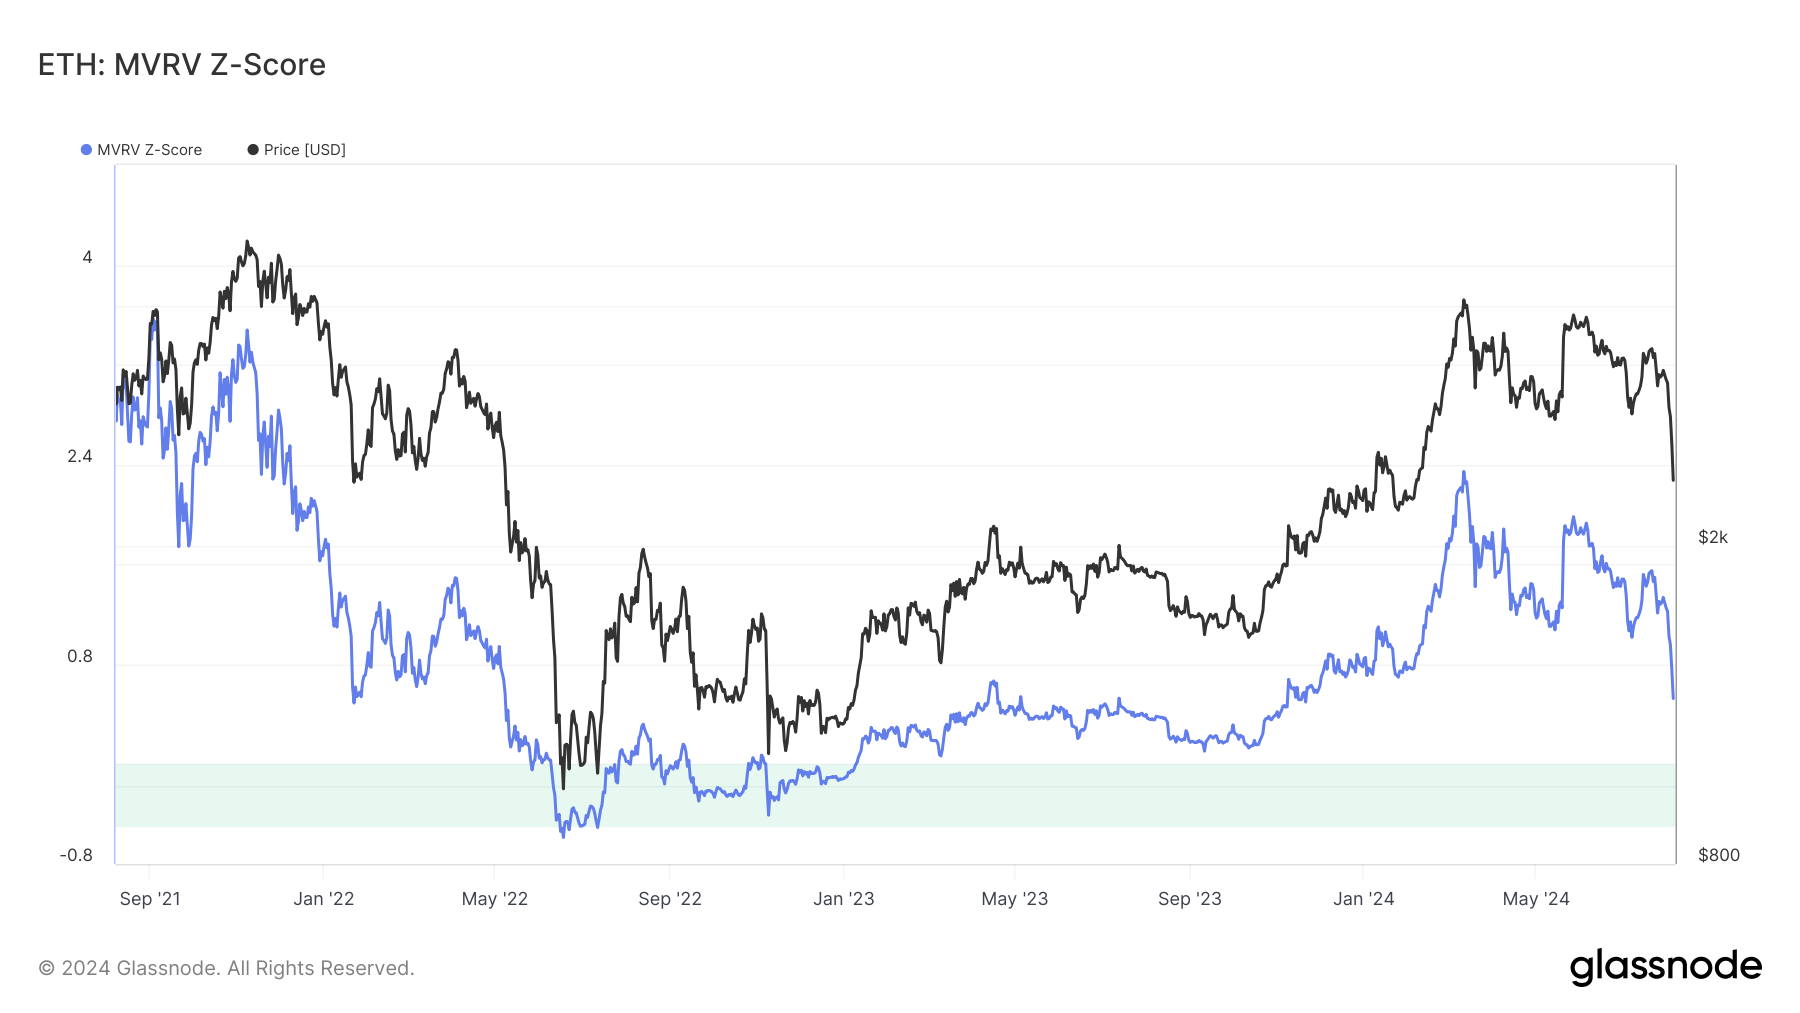 Ethereum Market Value to Realized Value Z-Score. Source: Glassnode
However, the chart above shows that ETH may have reached the bottom again, as the MVRV Z-Score is near the same reading as November 2023. During this period, ETH moved from $1,959 to over $4,000 in less than four months.
If this pattern plays out again, Ethereum’s price may surge more than 100% before the year ends. Another indicator reinforcing this thesis is the STH-NUPL, which stands for Short-Term Holder-Net Unrealized Profit/Loss.
Like the MVRV, this metric is crucial to identifying market tops and bottoms. Typically, the STH-NUPL’s euphoric (green) state signals the birth of the market top.
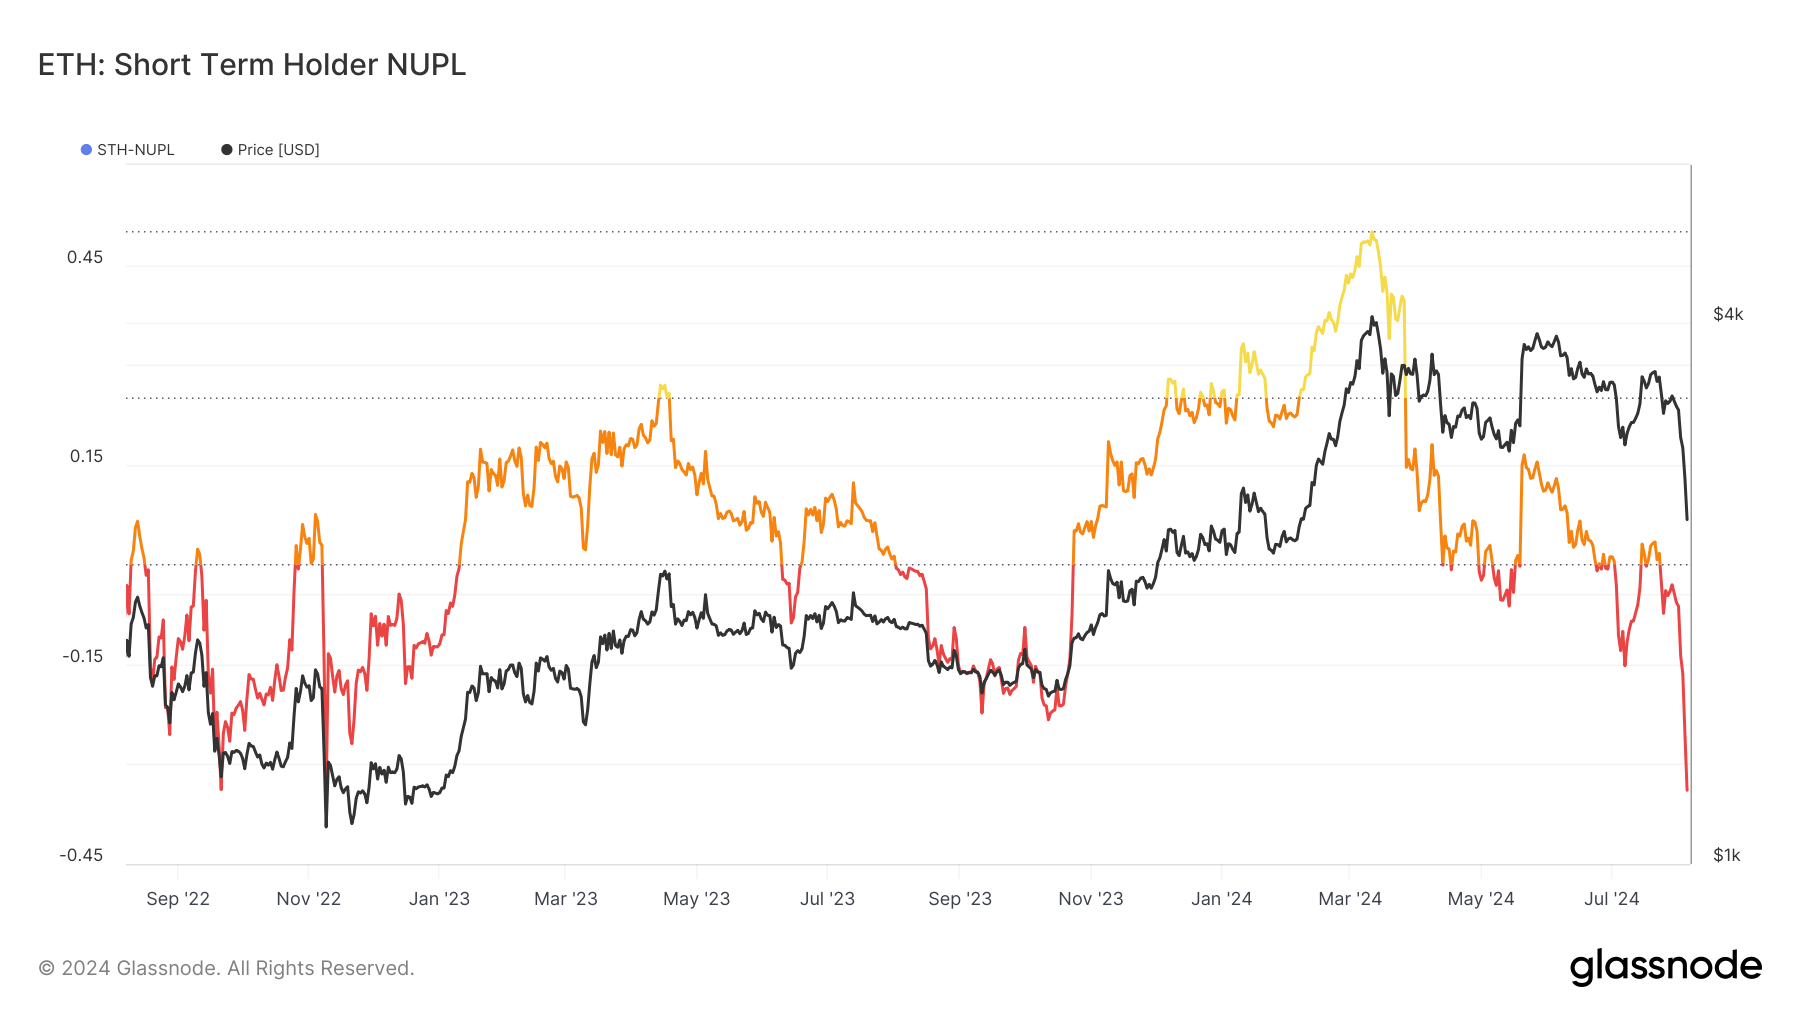 Ethereum Short-Term Holder-Net Unrealized Profit/Loss. Source: Glassnode
However, in ETH’s case, the metric is down to the capitulation region (red), indicating that the market is rife with fear. If previous patterns rhyme, then ETH has hit the bottom.
ETH Price Prediction: 100% Increase Before the Year Ends?
Like the on-chain state, technical indicators suggest that the ETH could follow a pattern similar to the performance in the first quarter of 2024.
Consider this — ETH’s price faced a notable correction between January 12 and 26. On January 27, the altcoin experienced a sharp recovery like the 7% hike ETH produced in the last 24 hours.
A few days later, the support spotted around $2,220, which was one reason the altcoin produced its best performance year to date. A look at the Relative Strength Index (RSI) also gives credence to the bias.
As seen below, the RSI, which measures momentum, was close to being oversold before the rally in January. For context, RSI readings at 30 or below indicate oversold positions, while those at 70 or below suggest overbought.
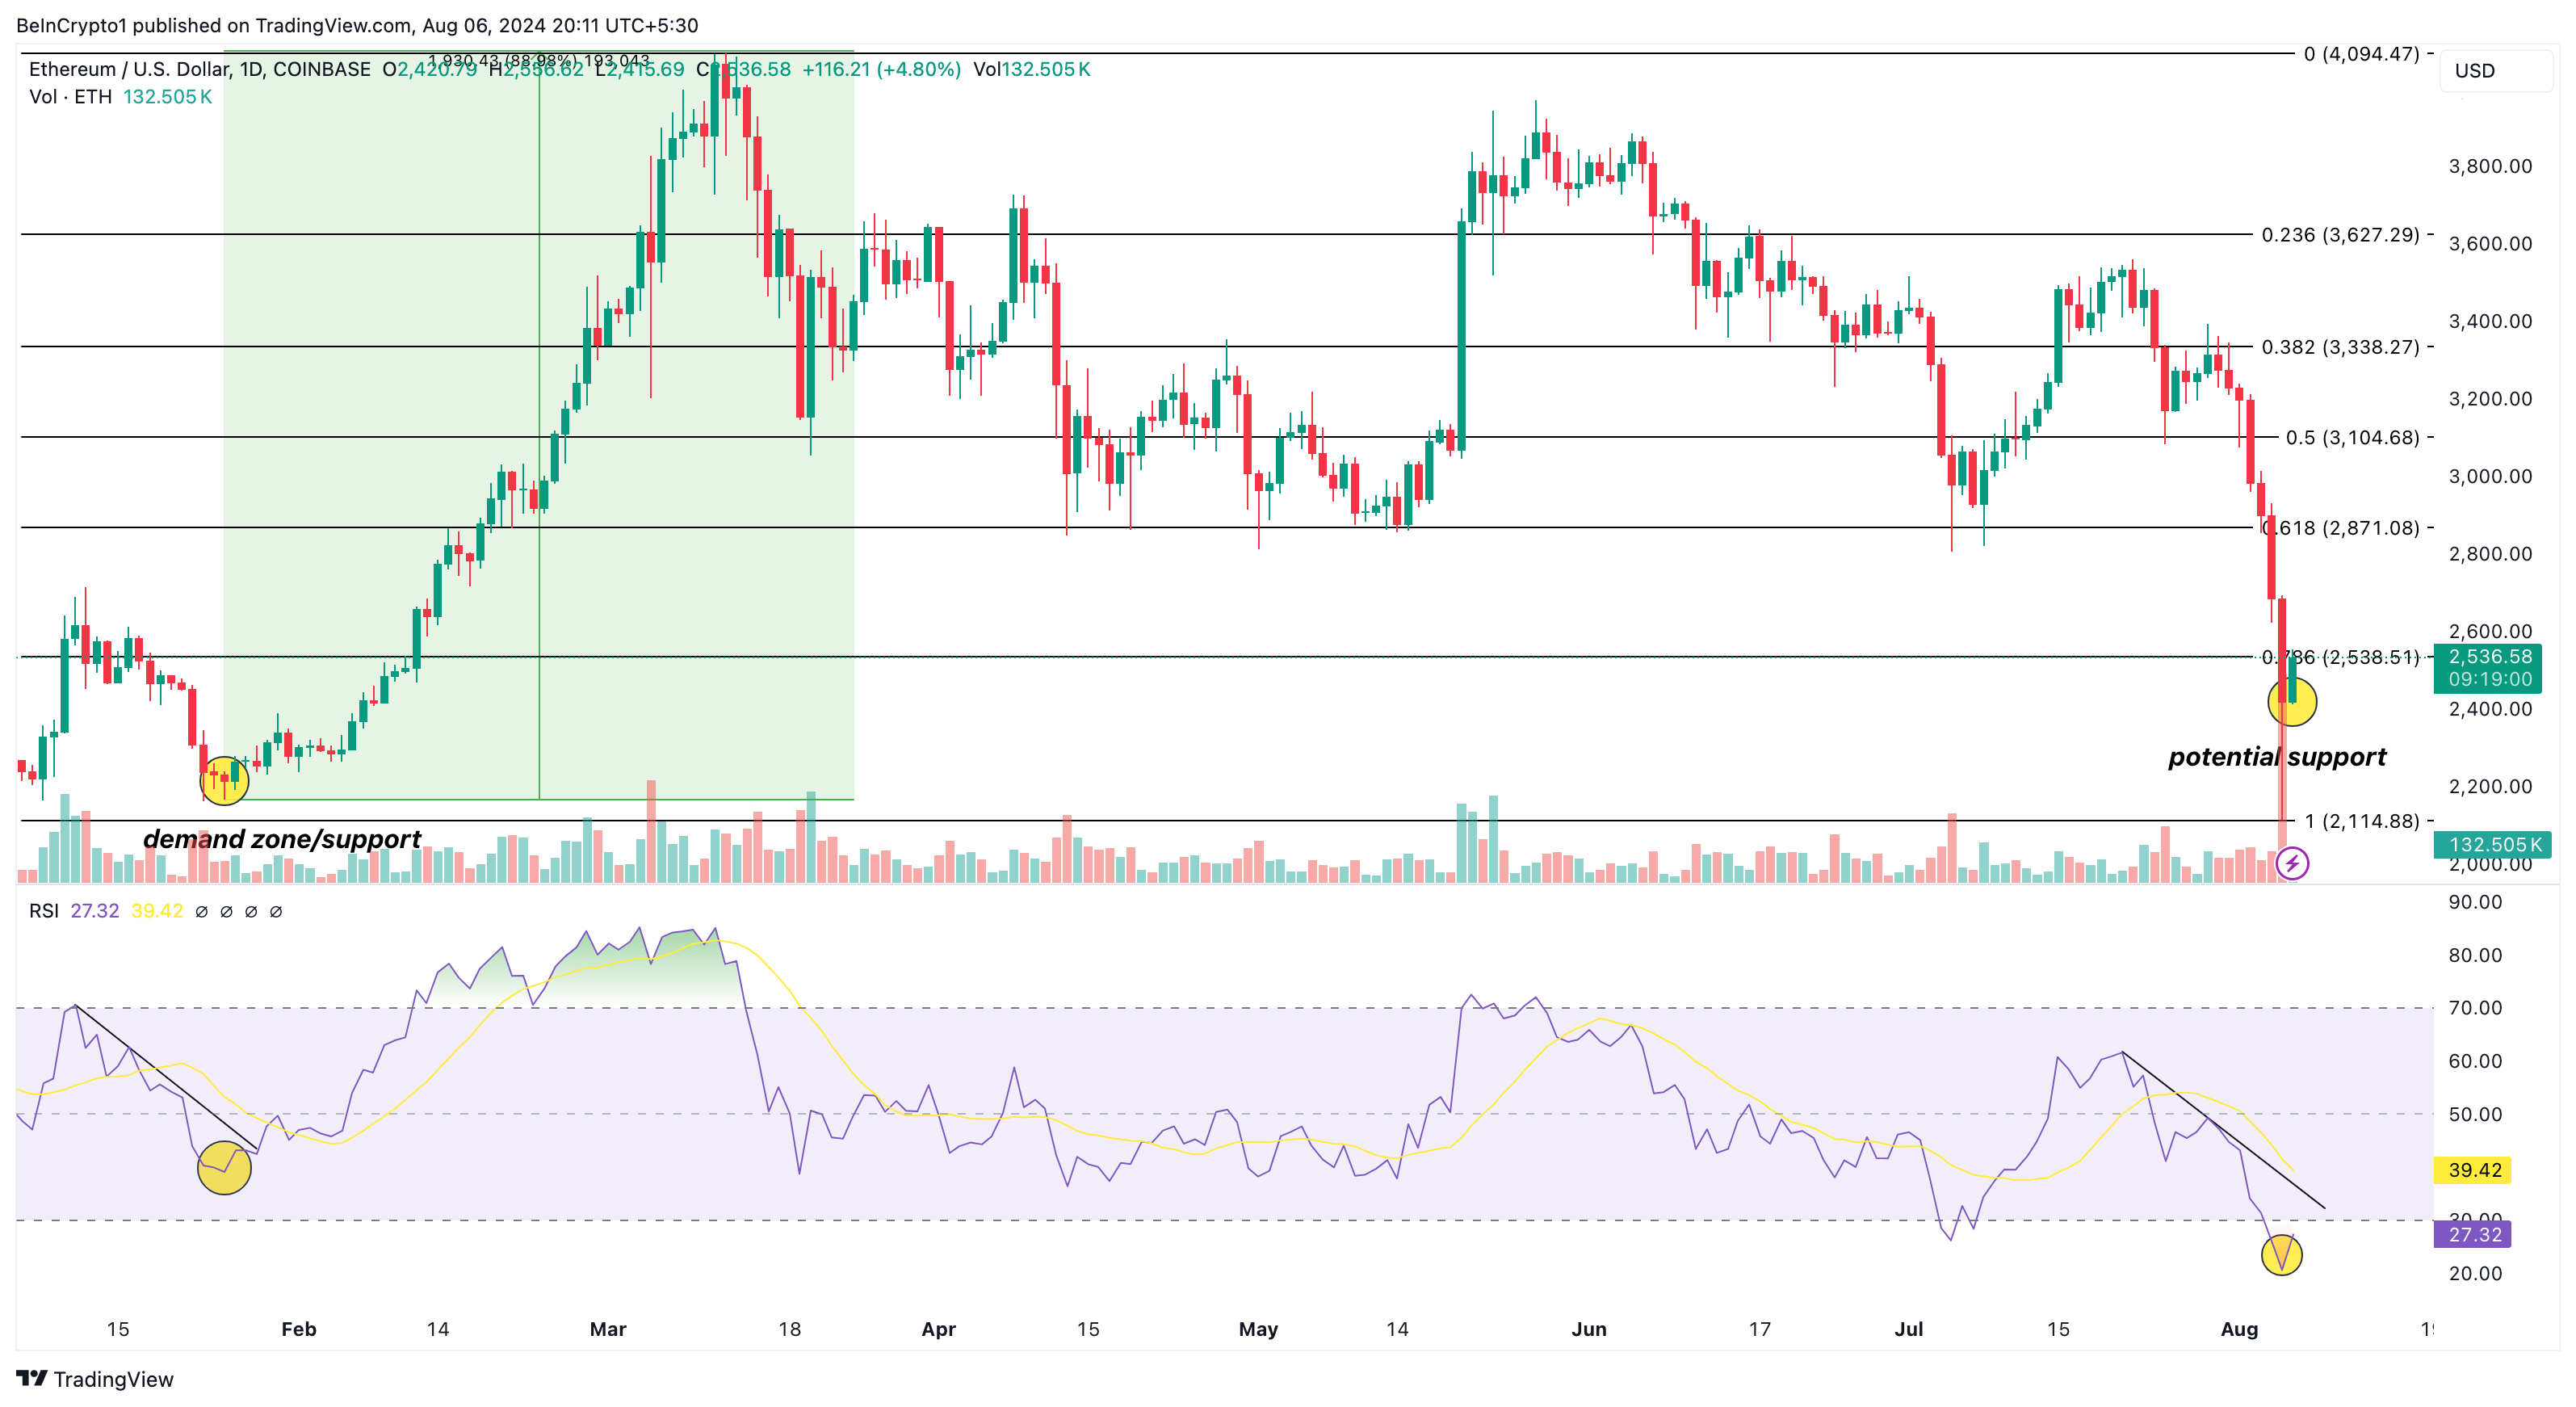 Ethereum Daily Analysis. Source: TradingView
Meanwhile, the cryptocurrency has hit the oversold point, indicating a higher chance of a notable bounce. This scenario could lead to ETH beginning with a retest of $2,871.
Further, sustained buying pressure could see the price hit $4,094 in a few months. However, this prediction may be invalidated if bulls fail to maintain the recent momentum.
* The content presented above, whether from a third party or not, is considered as general advice only. This article should not be construed as containing investment advice, investment recommendations, an offer of or solicitation for any transactions in financial instruments.


