

Dogecoin Could Rally To $0.74 ATH If Price Closes Month Above This Level, Analyst Says

- Gold Price Trend Forecast: Why Did Gold Prices Fall After US CPI Cooled? Fed Chair Speech and Iran Situation Become Obstacles
- Gold Price Trend Forecast: June CPI Plus Fed Chair Congressional Testimony, Can Gold Price Hold Above $4,000?
- TradingKey Daily Market Brief: Gold Falls Below $4,000, TSMC’s Strong Earnings Fail to Stop AI Trade Cooling, Chip Stocks Sold Off
- Gold slides back closer to $4,050 as Iran risks and Fed hike bets boost USD
- Gold Price Forecast: Cooling Inflation Fails to Offset Fed Hawkish Pressure, Gold Price May Fall to $3,500
- Today’s Market Recap: Unexpected PPI Drop Boosts Markets, Apple Hits All-Time High, AI Hardware Stocks Remain Under Pressure, Micron, SanDisk Slump

An analyst has explained how a Dogecoin monthly close above this level could pave the way for the memecoin to retest its all-time high (ATH).
Dogecoin Is Trading Around The Lower End Of An Ascending Channel
In a new post on X, analyst Ali Martinez has shared a technical analysis (TA) pattern that the monthly price of Dogecoin has been showing recently. The pattern in question is an “Ascending Channel,” which is a type of Parallel Channel.
Parallel Channels form when an asset’s price consolidates between two parallel trendlines. The upper line is likely to provide resistance in the future, while the lower one support. A break out of either of these levels can imply a continuation of trend in that direction.
Parallel Channels can be of three types. The most basic one involves trendlines that are parallel to the time-axis. This case emerges when consolidation happens in a sideways manner.
The other two types form when the asset consolidates at an angle. When this happens in the up direction, the channel forming is known as an Ascending Channel. Similarly, a downward consolidation results in a Descending Channel. In the context of the current topic, the former of the two is of interest.
Since an Ascending Channel represents a phase of net upward consolidation in the price, its upper line connects together higher highs and the lower one higher lows.
Below is the chart shared by the analyst that shows the Ascending Channel that the 1-month price of Dogecoin has been stuck inside for the last several years.
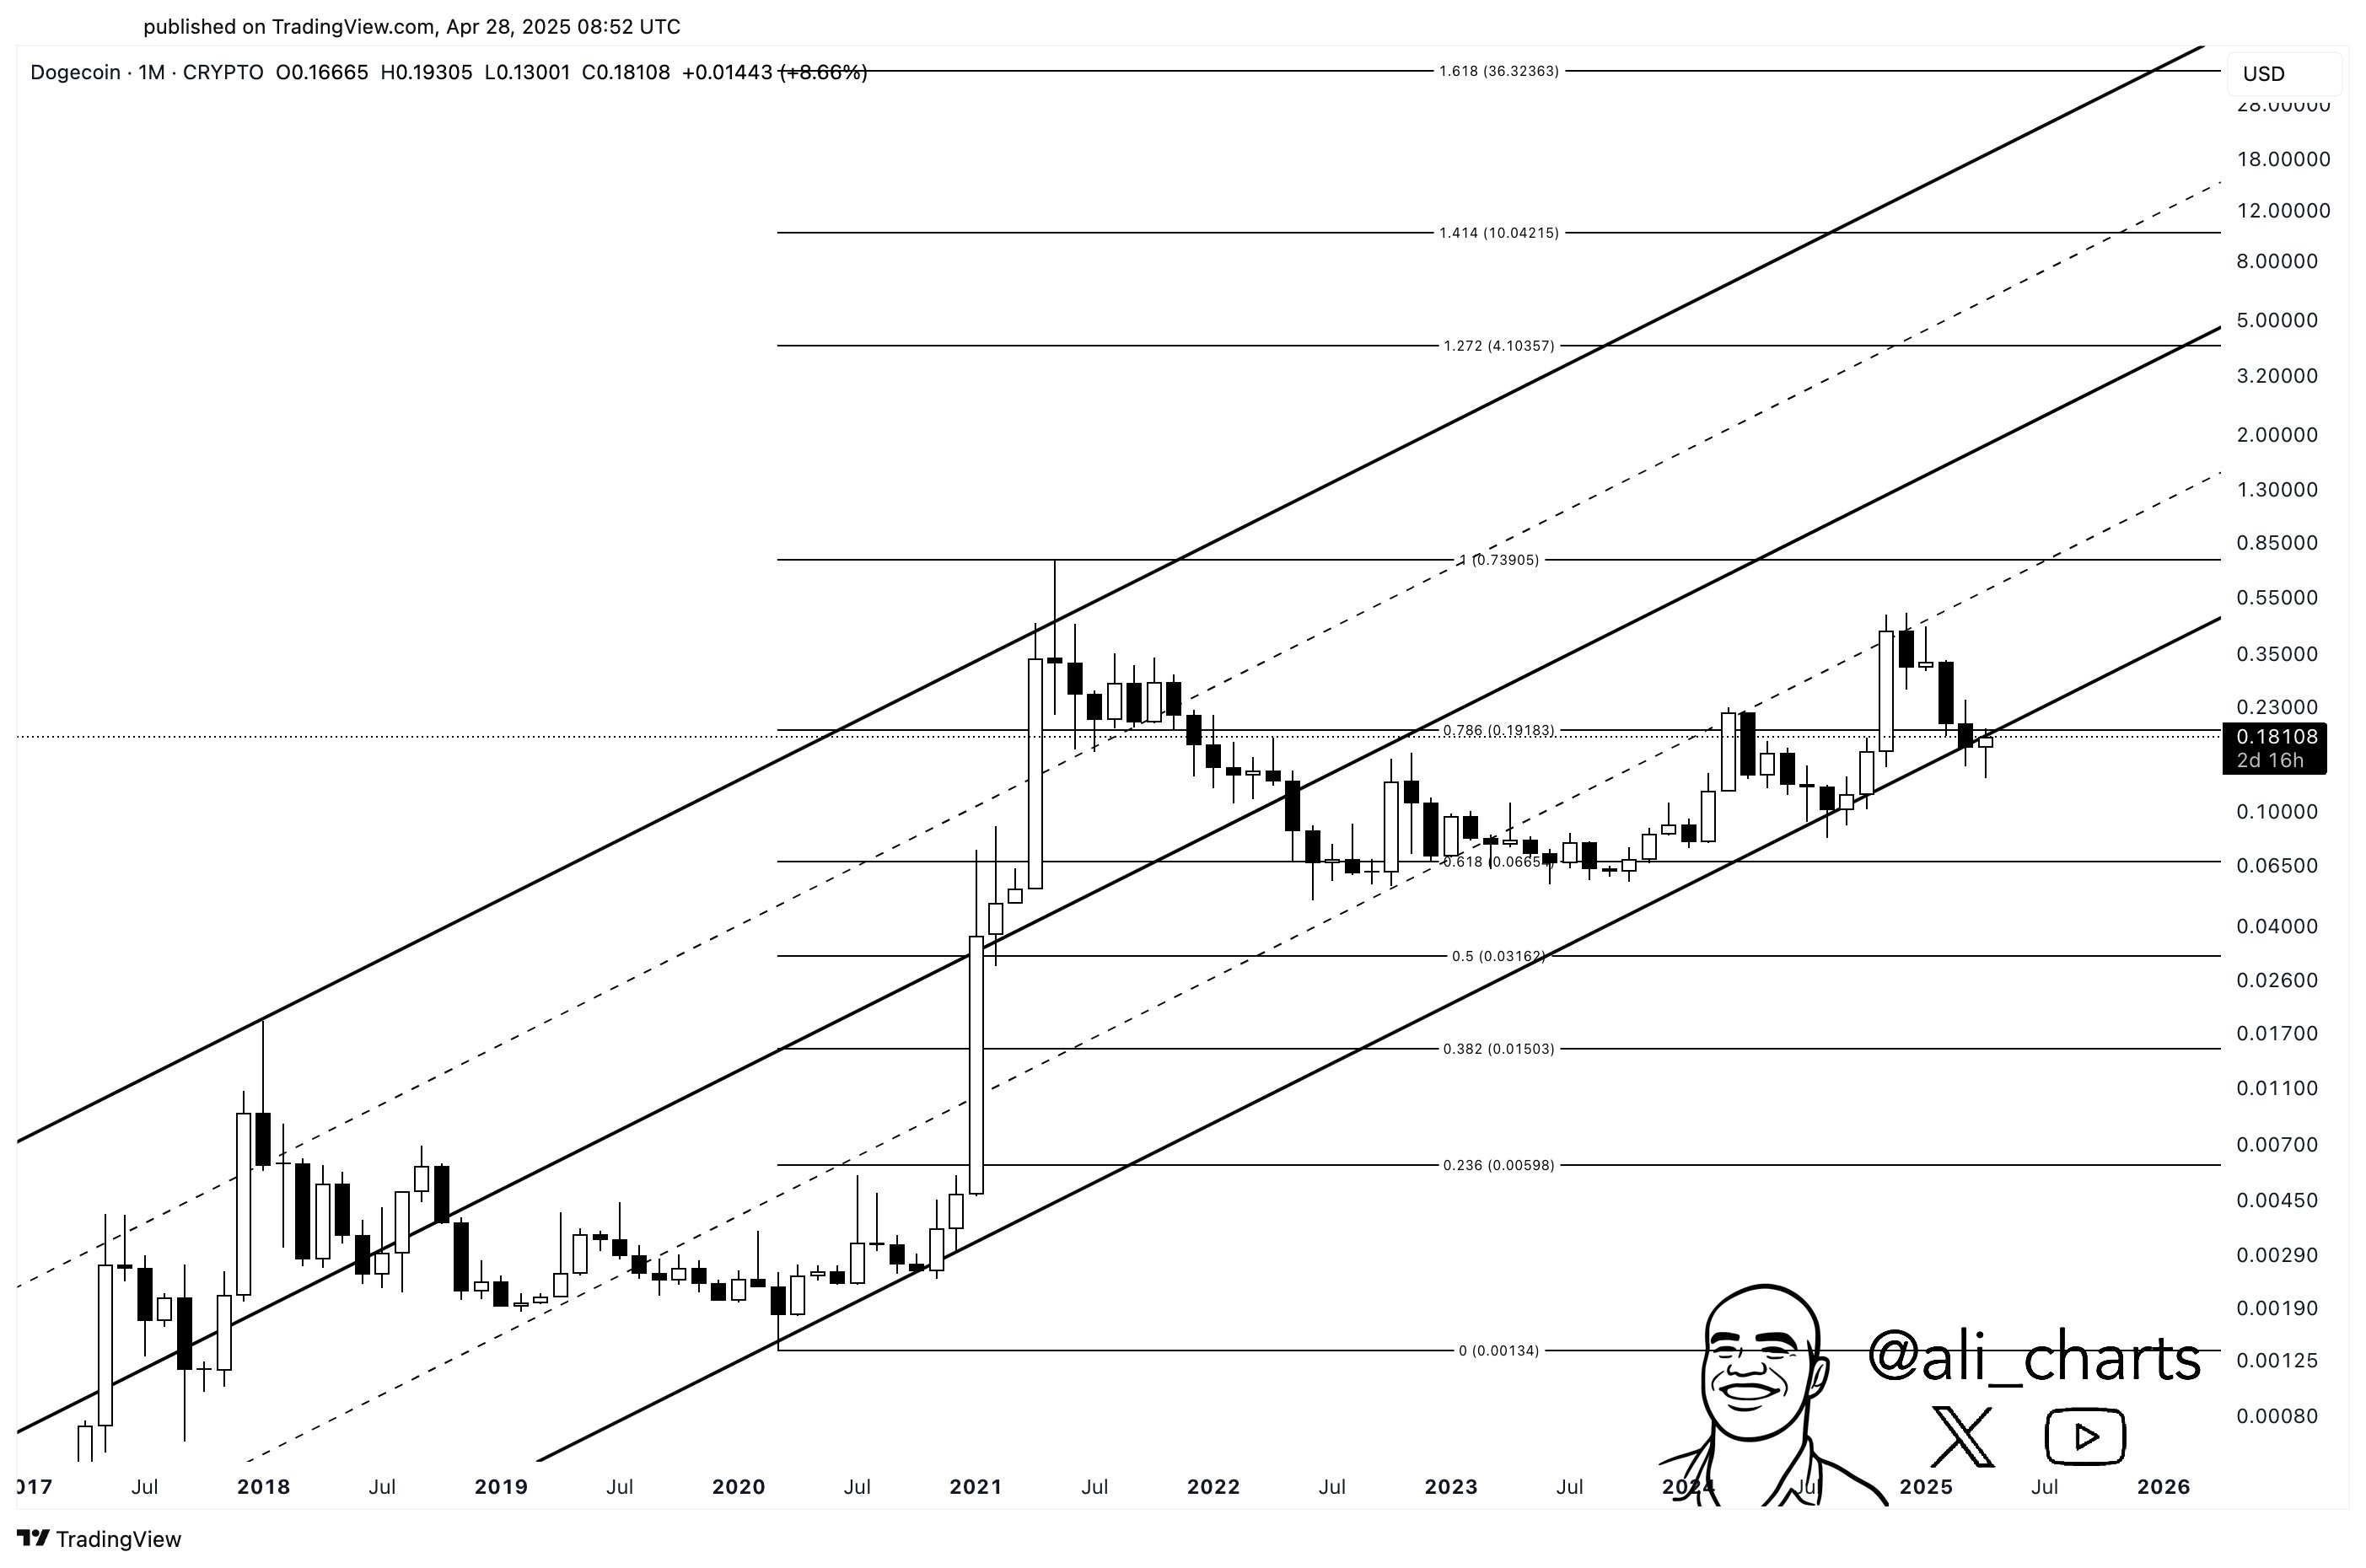
As is visible in the above graph, the 1-month Dogecoin price has recently fallen to the lower level of this long-term Ascending Channel and appears to be slipping under it. If the memecoin now sees a sustained move down, a breakout toward the downside could be confirmed.
In the scenario that it can recover above the lower level of the channel again, however, its path may once again become that charted out by the pattern. The bottom level of the Ascending Channel isn’t the only one that the asset is very close to breaking above; there is also the 0.786 Fibonacci Retracement level.
Fibonacci Retracement levels are based on ratios from the famous Fibonacci series. The 0.786 Fibonacci Retracement line from the chart is situated around the $0.20 price level. The next major level, the 1.000 Retracement, corresponds to DOGE’s ATH of around $0.74.
As Martinez explains, If Dogecoin $DOGE can secure a monthly close above $0.20, it could pave the way for a rally toward its all-time high of $0.74. Such a breakout would signal strong bullish momentum and potentially attract increased investor interest.
DOGE Price
At the time of writing, Dogecoin is trading around $0.17, up over 9% in the last week.
Read more
* The content presented above, whether from a third party or not, is considered as general advice only. This article should not be construed as containing investment advice, investment recommendations, an offer of or solicitation for any transactions in financial instruments.


