

Chainlink Price at Risk of Further Decline as 200 Largest Addresses Sit on Unrealized Profits

Mitrade
coverImg
Source: DepositPhotos
  • Chainlink ecosystem’s 200 largest wallet addresses scooped up 40.18 million LINK tokens in October. 

  • Large wallet investors accumulated LINK at $7.40, the altcoin’s price has nearly doubled in the past month. 

  • LINK price is at risk of correcting lower with bearish divergence in on-chain metrics. 


Chainlink price is in an uptrend that started in September. LINK price rallied nearly 60% in the last 30 days, before beginning its recent pullback. LINK price is down 2% on the day, there is a likelihood of further decline in the altcoin’s price, in the near term. 


Chainlink large wallet addresses could shed their holdings

Chainlink’s 200 largest wallet contain 40.18 million LINK tokens, worth $570.15 million at the current price ($14.19 per LINK token) on October 17, according to Santiment data. The crypto intelligence tracker noted that post the accumulation by LINK whales, the asset’s price rallied 125% within a 25-day timeframe, pushing the price from $7.40 to $14.60, a 94.6% gain. 


While LINK price nearly doubled, the wallets holding Chainlink tokens have yet to shed their holdings or engage in profit taking. The LINK token balance of these wallet addresses has remained high since October 17, pointing to an increased chance of a profit-taking event in the near future. When LINK whales shed their holdings and book unrealized profits, the selling pressure on Chainlink could push the asset’s price lower. 
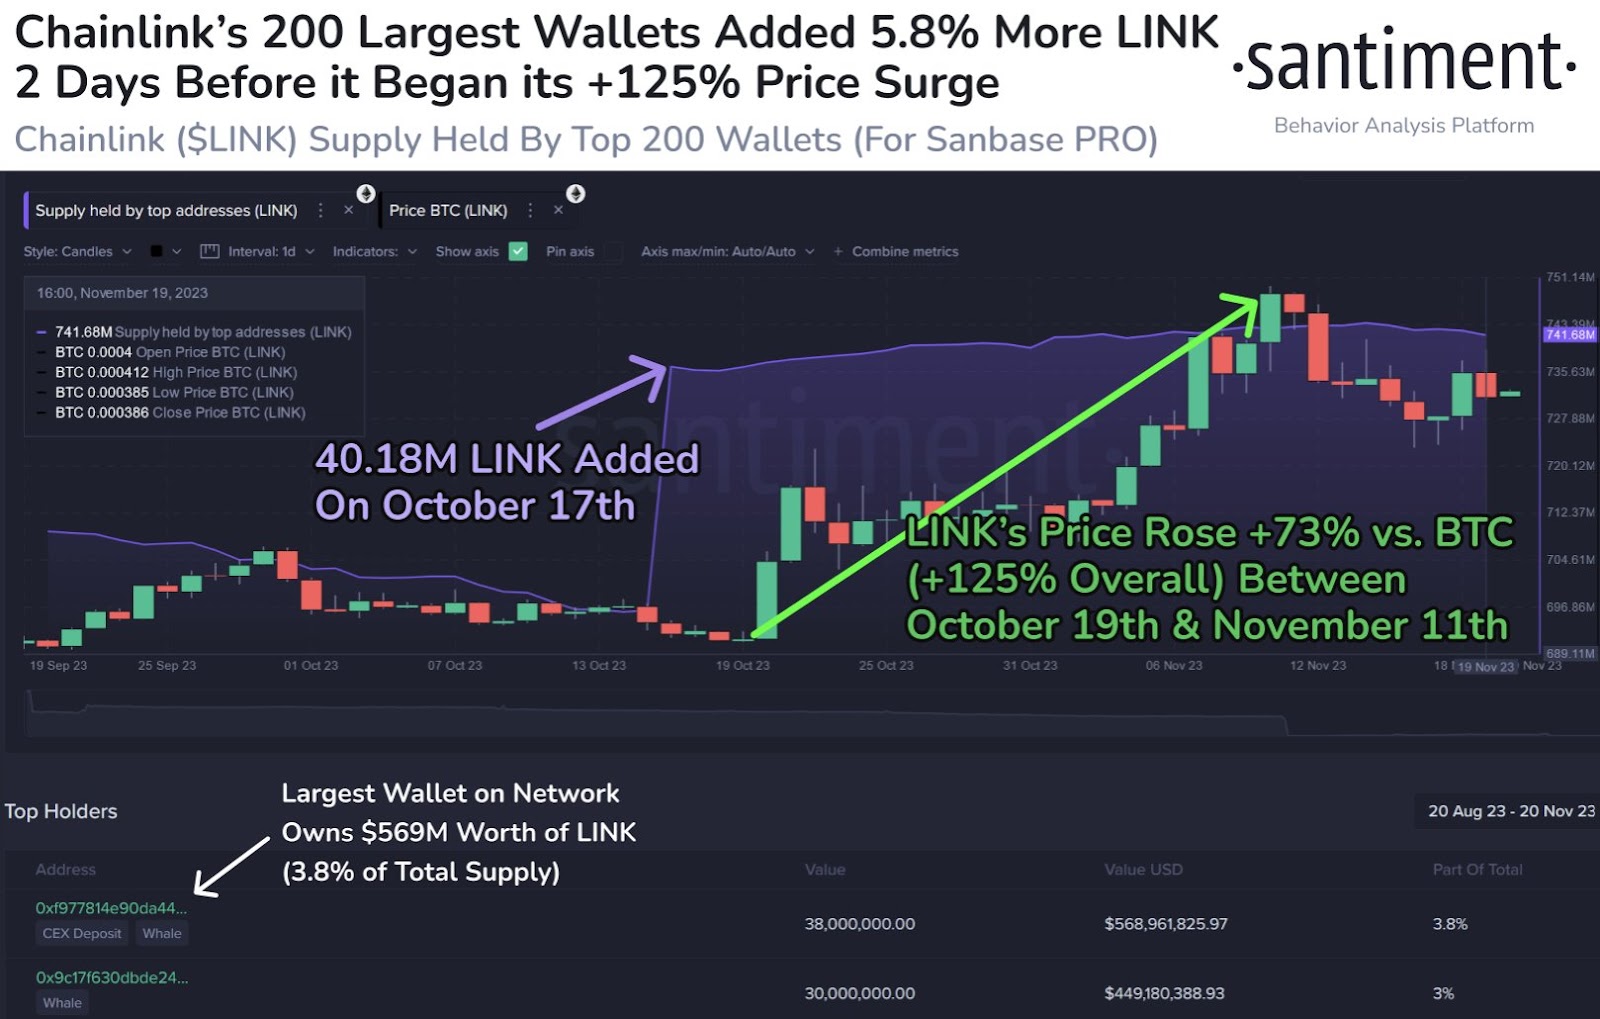
Chainlink whales sit on unrealized profits

Chainlink whales sit on unrealized profits, Source: Santiment.


On-chain metrics, Active Addresses and Network Realized Profit/Loss, support the bearish scenario. While LINK price nearly doubled in a 25-day timeframe, active addresses did not climb accordingly, revealing an underlying bearish divergence in LINK. 

LINK

LINK Active Addresses and price, Source: Santiment.


The Network Realized Profit/Loss metric that notes whether market participants selling the asset are realizing profits or realizing losses, supports the bearish thesis. LINK holders have engaged in profit-taking, represented by the spikes in the chart below. Profit-taking activities are typically followed by a correction in the asset’s price, suggesting the possibility of more downside. 
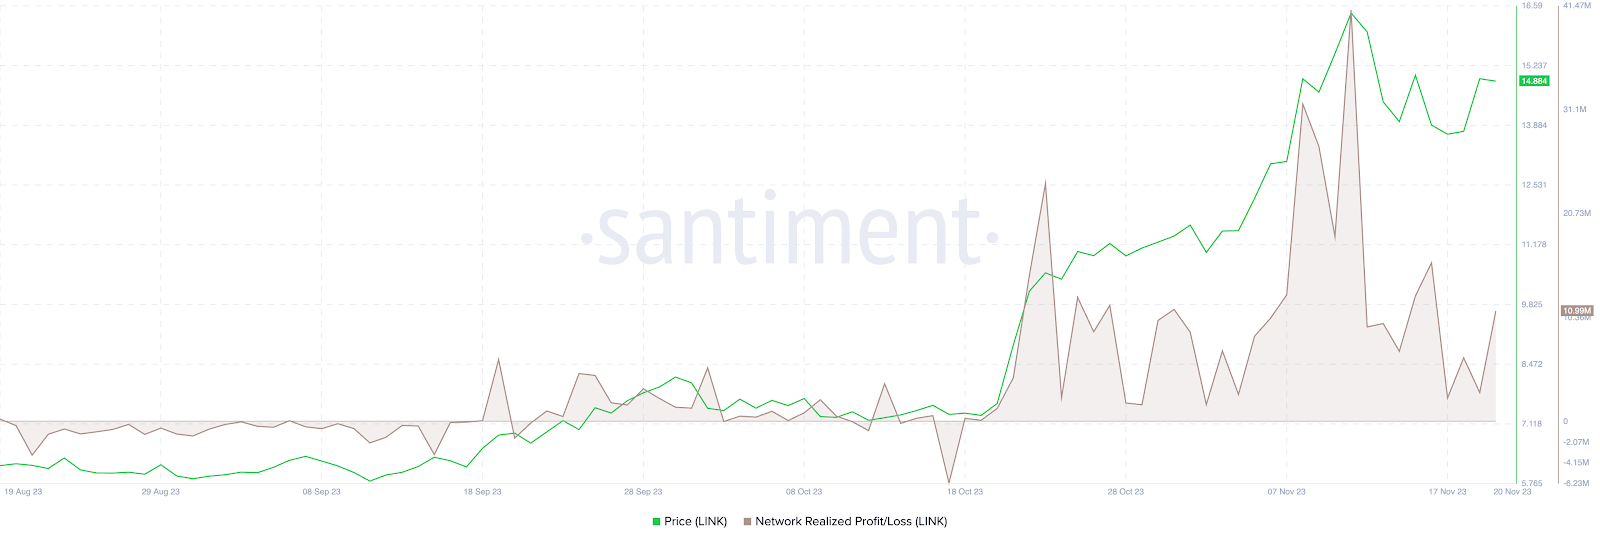
LINK price and network realized profit/loss

LINK price and Network Realized Profit/Loss, Source: Santiment.


The exchange flow balance, a metric that notes the netflow from cryptocurrency exchange platforms and the supply on exchanges as a % of total supply, are used to identify whether there is incoming selling pressure on the asset. This helps determine the likely direction of the price trend. In the case of LINK, on the monthly time frame, there are large inflows, the volume of Chainlink token inflows is higher than outflows, as seen in the chart below.


At the same time, the supply on exchanges increased to 15.29% of the total supply, as on Tuesday. LINK tokens are flowing into exchanges, consistently, contributing to the rise in the % of total supply across exchange platforms, this points at a brewing selling pressure on the asset. If the inflow of LINK to exchanges continues, it could result in a decline in the asset’s price. 
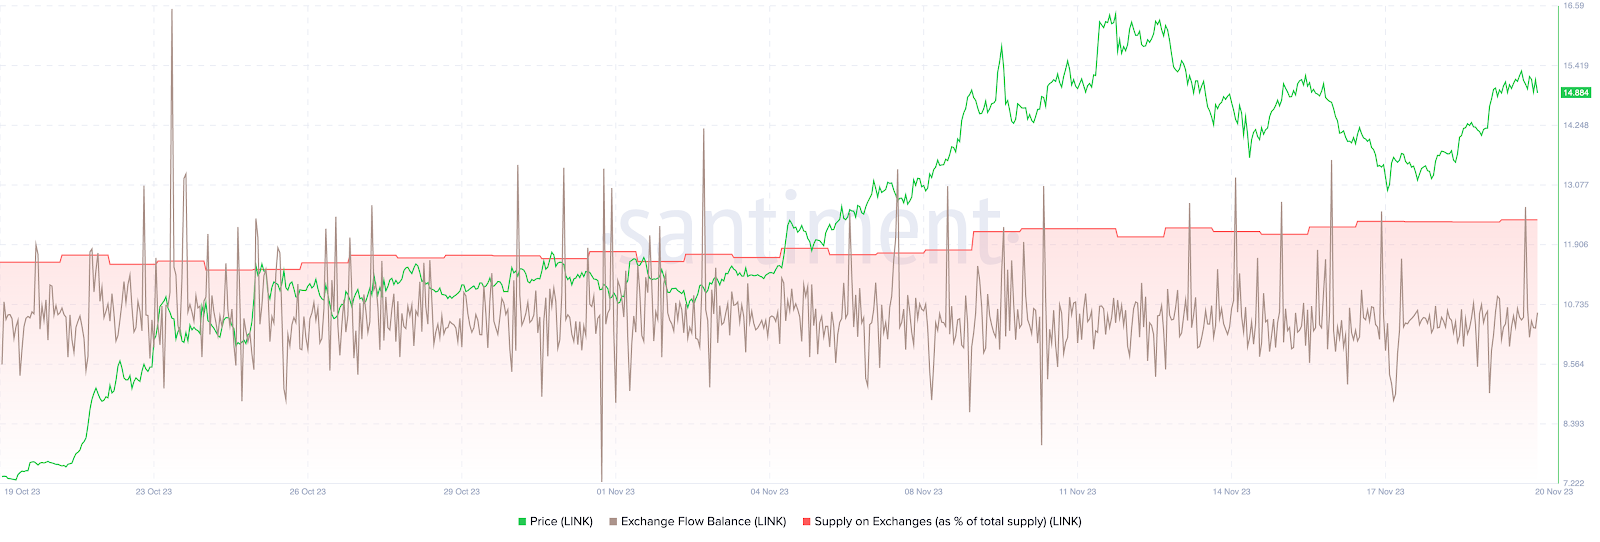
LINK

Chainlink supply on exchanges and exchange flow balance, Source: Santiment.


At the time of writing, LINK price is $14.08 on Binance, the asset is down 2% on the day.


Read more

  • Gold Hits Near 1.5-Year Low Below $3,800 as Bears Threaten Drop to $3,500
  • US Dollar Index Price Forecast: DXY could target 104.00 as bulls await FOMC Minutes
  • Nvidia posts record $115.8B Q3 revenue, but crypto stays muted
  • Australian Dollar declines below 0.6750 after RBA minutes, US Retail Sales data in focus
  • Nvidia Q3 Earnings Loom as Market Expects Revenue Near $109 Billion: Can NVDA Stock Hold $150?
  • Note: If you want to share the article 《Chainlink Price at Risk of Further Decline as 200 Largest Addresses Sit on Unrealized Profits》, make sure you retain the original link. For more information, please visit Insights or browse www.mitrade.com.

    * The content presented above, whether from a third party or not, is considered as general advice only.  This article should not be construed as containing investment advice, investment recommendations, an offer of or solicitation for any transactions in financial instruments.

    goTop
    quote
    Related Articles
    placeholder
    Nvidia posts record $115.8B Q3 revenue, but crypto stays mutedThe crypto market remained subdued on Tuesday despite Nvidia's (NVDA) Q3 earnings release beating analysts' expectations as demand for artificial intelligence infrastructure continued to drive growth across its business.
    Author  FXStreet
    Yesterday 01: 46
    The crypto market remained subdued on Tuesday despite Nvidia's (NVDA) Q3 earnings release beating analysts' expectations as demand for artificial intelligence infrastructure continued to drive growth across its business.
    placeholder
    Ethereum Drops Below $2,000 After Plunging Over 20% in a Month as Odds of $1,500 Retest SurgeEthereum Plunges Over 20% in a Month, Risking a Retest of $1,500 After Losing the $2,000 Defense Line.On November 13, Ethereum (ETH) plunged more than 5%, officially falling below the key
    Author  TradingKey
    Nov 13, Fri
    Ethereum Plunges Over 20% in a Month, Risking a Retest of $1,500 After Losing the $2,000 Defense Line.On November 13, Ethereum (ETH) plunged more than 5%, officially falling below the key
    placeholder
    Bitcoin lost its 200-day average — but the exit started three sessions before the CPIBitcoin fell 2.5% to about $73,400 on 11 November, an 11-week low, breaking its 200-day moving average near $73,100. The 24-hour liquidation tally reached $632 to $705 million, roughly 82% of it longs. But spot ETF outflows began three sessions earlier and USDT's market cap has shrunk $6.6 billion in 60 days — the leveraged length left before the inflation print did. A double top at 81,890 and 81,080 leaves a measured target of 69,366.
    Author  Suzie
    Nov 11, Wed
    Bitcoin fell 2.5% to about $73,400 on 11 November, an 11-week low, breaking its 200-day moving average near $73,100. The 24-hour liquidation tally reached $632 to $705 million, roughly 82% of it longs. But spot ETF outflows began three sessions earlier and USDT's market cap has shrunk $6.6 billion in 60 days — the leveraged length left before the inflation print did. A double top at 81,890 and 81,080 leaves a measured target of 69,366.
    placeholder
    Bitcoin Price Forecast: BTC faces pressure as weekly ETF outflows hit $1.28 billionBitcoin (BTC) remains under pressure on Monday, trading below the 50-week Simple Moving Average (SMA) at $75,222 after extending its losing streak to five consecutive weeks.
    Author  FXStreet
    Nov 09, Mon
    Bitcoin (BTC) remains under pressure on Monday, trading below the 50-week Simple Moving Average (SMA) at $75,222 after extending its losing streak to five consecutive weeks.
    placeholder
    Bitcoin ETFs sold $1.28 billion in a week — and BTC is still above 75,000US spot Bitcoin ETFs logged $1.28 billion of net outflows in the week to Nov 6, the largest since late June, with BlackRock's IBIT accounting for $1.21 billion. Yet BTC only fell from $80,405 to $74,940, a 6.8% move. The gap between the fund flow and the price is the story: leveraged longs were flushed, but spot holders did not follow the ETFs out — and $75,000 is the line that decides whether that reading holds.
    Author  Suzie
    Nov 09, Mon
    US spot Bitcoin ETFs logged $1.28 billion of net outflows in the week to Nov 6, the largest since late June, with BlackRock's IBIT accounting for $1.21 billion. Yet BTC only fell from $80,405 to $74,940, a 6.8% move. The gap between the fund flow and the price is the story: leveraged longs were flushed, but spot holders did not follow the ETFs out — and $75,000 is the line that decides whether that reading holds.
    Live Quotes
    Name / SymbolChart% Change / Price
    LINKUSD
    LINKUSD
    0.00%0.00
    BTCUSD
    BTCUSD
    0.00%0.00

    cryptocurrency Related Articles

    • Top 3 Price Prediction: Bitcoin, Ethereum, Ripple — Bulls take the reins, with $100K BTC, $3,500 ETH and $2.35 XRP in focus
    • Best Strategies When BTC Price Drops: From Hedging to Accumulating
    • How to Day Trade Crypto? Simplest Day Trading Strategy Ever
    • Trading Chart Patterns:Ultimate Guide to Price Action
    • Places that Provide Cheapest Ways to Buy Bitcoin In 2025
    • 10 Best Crypto With Most Potential to Buy and invest in 2025 - Top Picks from Expert Traders

    Click to view more