

Top 3 Price Prediction Bitcoin, Ethereum, Ripple: BTC, ETH and XRP still show signs of weakness

- US-Iran Agreement Brought Forward: Pakistani Prime Minister Confirms US-Iran Agreement Has Taken Effect Immediately, Strait of Hormuz Will Reopen Immediately
- WTI hovers around $80.00 as traders await developments on US-Iran peace talks
- Gold rises to weekly high as US, Iran reach peace deal
- Gold Price Forecast: Hawkish Fed Triggers Gold Plunge, Can US-Iran Agreement Push Gold Past $4,360?
- Has Gold Hit Bottom? Barclays, Citi Both Bullish on Gold, Gold Price Will Return to $5,000 Next Year.
- New Fed Chair to Cut Forward Guidance? Warsh Rejects Dot-Plot Expectations, Bullish or Bearish for Bitcoin?

Bitcoin hovers around $98,000 on Wednesday after falling 3.5% the previous day.
Ethereum price failed to recover, trading around $2,700, hinting at a downleg ahead.
Ripple price closes below its ascending trendline, changing the market structure from bullish to bearish.
Bitcoin (BTC), Ethereum (ETH) and Ripple (XRP) hover around key levels on Wednesday after failing to maintain their recoveries from the recent falls this week. The technical outlook for all these top cryptocurrencies shows signs of weakness and suggests a further correction ahead.
Bitcoin fails to maintain levels above $100,000
Bitcoin price faced a pullback in the early Asian trading session, reaching a low of $91,231, but quickly recovered from its fall to close above $101,300 on Monday. However, it failed to maintain its recovery and declined 3.52% on Tuesday. At the time of writing on Wednesday, it hovers around $98,000.
If BTC continues its correction, it could extend the decline to test its psychologically important level of $90,000.
The Relative Strength Index (RSI) on the daily chart reads 44, after being rejected from below its neutral level of 50, and points downwards, indicating a strong bearish momentum. Moreover, the Moving Average Convergence Divergence (MACD) showed a bearish crossover, hinting at further correction.
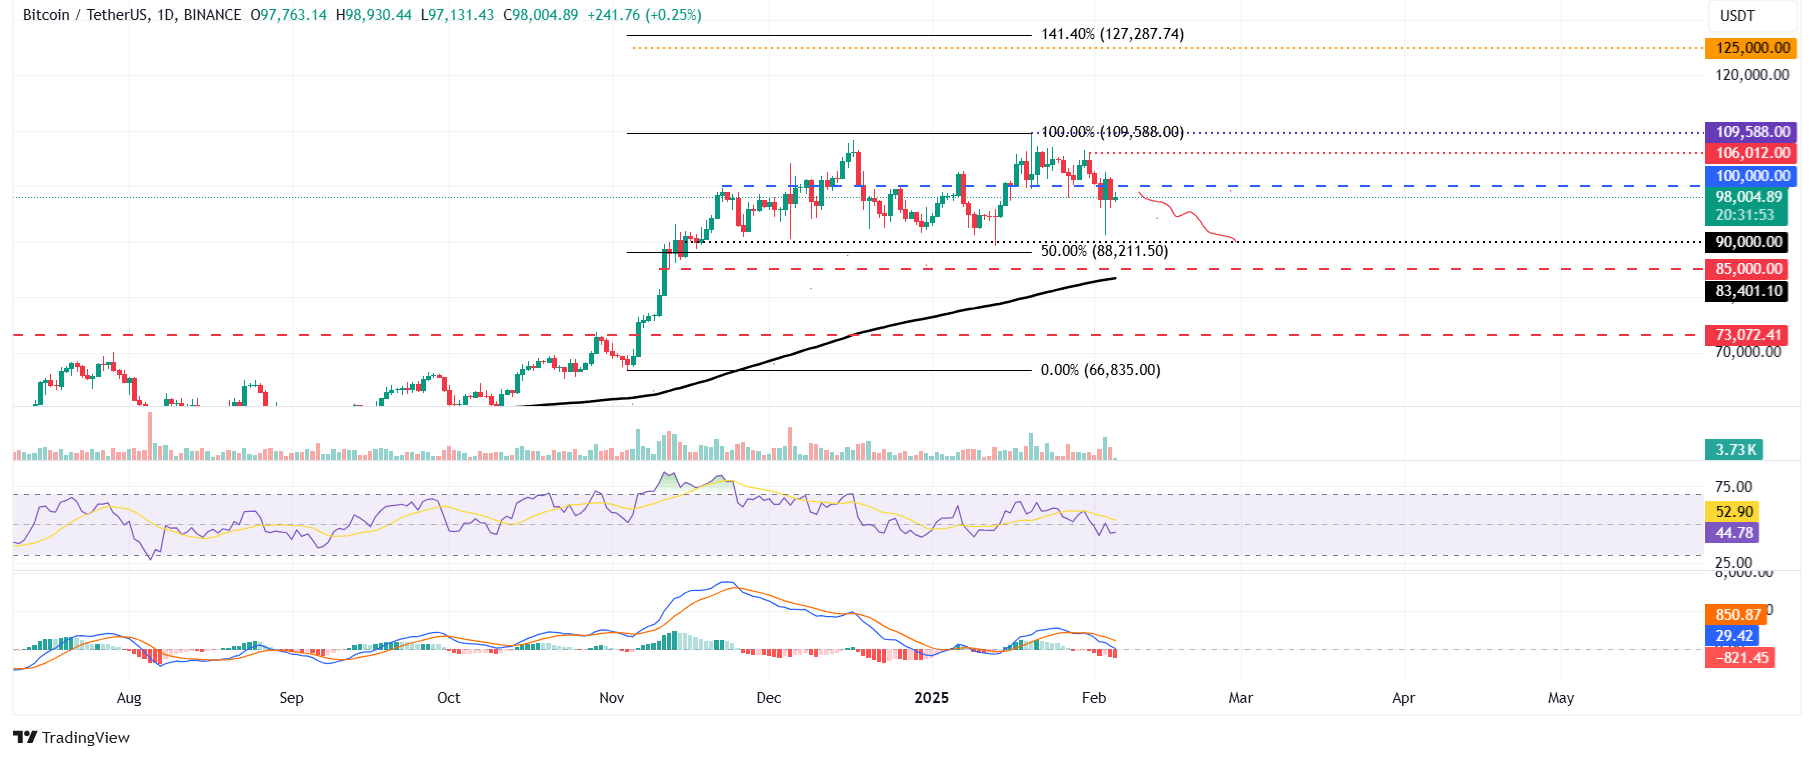
BTC/USDT daily chart
However, if BTC recovers and finds support around $100,000, it would extend the recovery to retest its Friday high of $106,012.
Ethereum bears aiming for $2,300 level
Ethereum price faced a rejection around its descending trendline on Saturday and declined 13.87%, closing below its $3,000
psychologically important level the next day. On Monday, ETH dips and reaches a low of $2,125 but quickly recovers to close at $2,879.
However, it failed to maintain its recovery and declined 5.16% on Tuesday. At the time of writing on Wednesday, it hovers around $2,731.
If ETH continues its decline and closes below $2,359, it will extend the decline to test its next weekly support at $1,905.
The RSI on the daily chart reads 31, nearing its oversold level of 30, indicating a strong bearish momentum. The MACD also continues to show a bearish crossover, suggesting the continuation of a bearish trend.
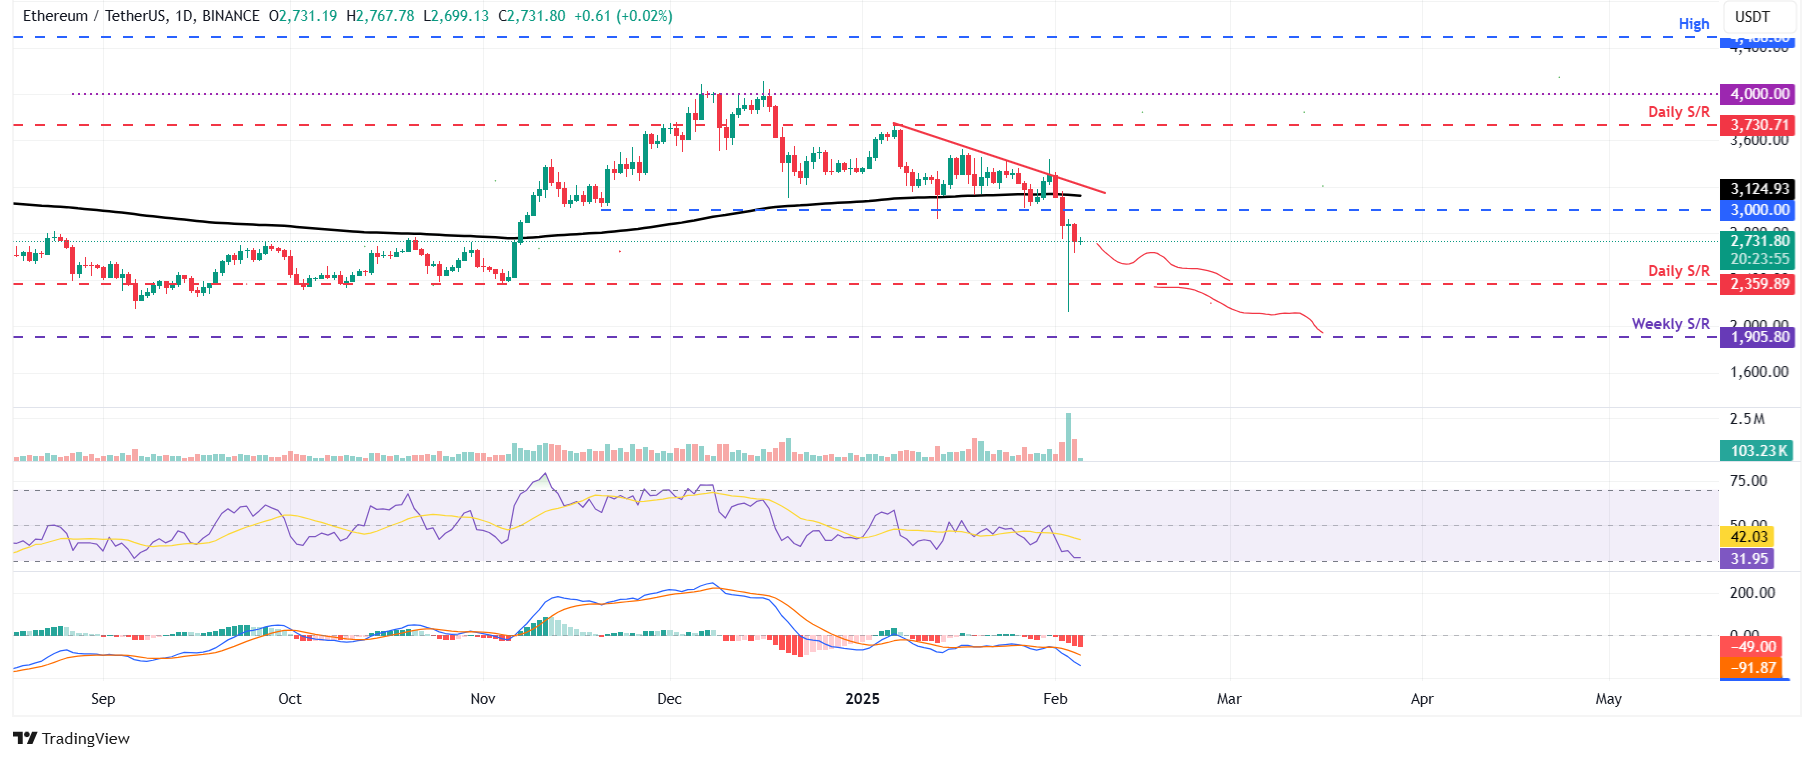
ETH/USDT daily chart
On the other hand, if ETH recovers, it could extend the recovery to test its $3,000 level.
Ripple price is set for a downward move as it closes below its ascending trendline
Ripple price breaks below its ascending trendline (drawn by connecting multiple lows since early January) on Sunday and declines by 10.35%, closing below its 50-day EMA at $2.60. On Monday, Ripple dips and reaches a low of $1.77 but quickly recovers to close at $2.70. However, it failed to maintain its recovery and declined 6.40% on Tuesday. At the time of writing on Wednesday, it hovers around $2.51.
If XRP continues its pullback and closes below its daily support at $1.96. It could extend the decline to test its weekly support level at $1.40.
The RSI on the daily chart reads 38, around its oversold level of 30, indicating a strong bearish momentum. The MACD also continues to show a bearish crossover, suggesting the continuation of a bearish trend.
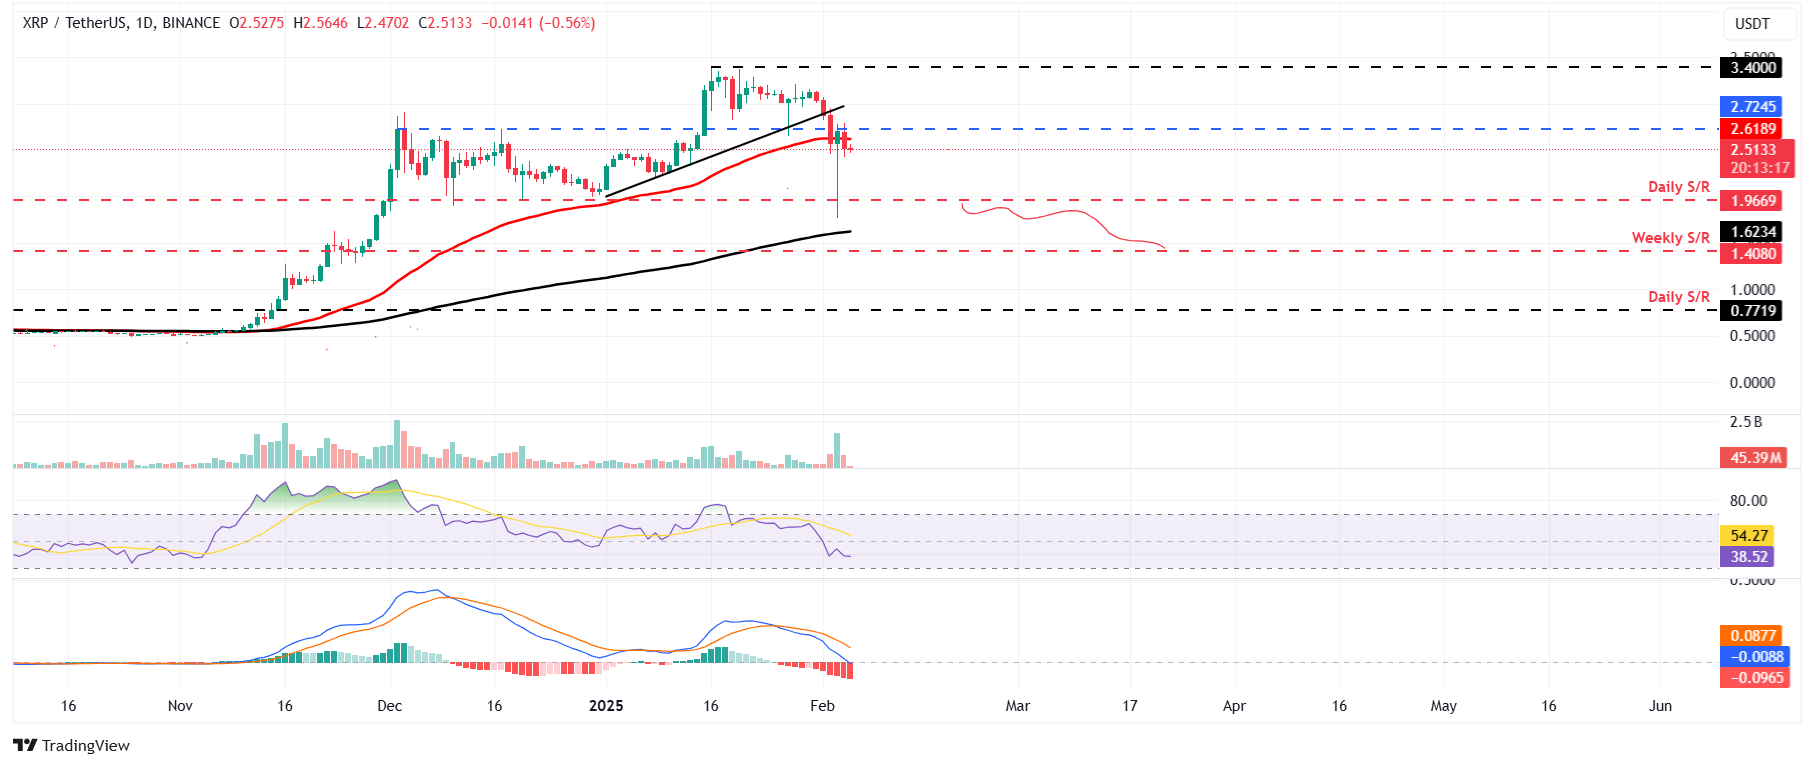
XRP/USDT daily chart
However, if XRP recovers, it could extend the recovery to test its daily resistance level at $2.72.
Read more
* The content presented above, whether from a third party or not, is considered as general advice only. This article should not be construed as containing investment advice, investment recommendations, an offer of or solicitation for any transactions in financial instruments.


