
Top 3 Price Prediction: BTC, ETH and XRP struggle as selling pressure mounts

- Gold Price Forecast: XAU/USD holds positive ground above $4,100 as Fed rate cut expectations rise
- Australian Dollar receives support following cautious remarks from RBA Hauser
- Gold draws support from safe-haven flows and Fed rate cut bets
- Australian Dollar declines as US Dollar gains amid nearing government shutdown end
- CoreWeave Q3 2025 Earnings Analysis: Short-Term Hypergrowth vs. Long-Term Leverage Risks—Trading Opportunity or Trap?
- USD/JPY tests 155 as Tokyo fix buying lifts pair – ING

Bitcoin price hovers around $107,800 on Monday after falling 5.49% in the previous week.
Ethereum slips below the $4,000 mark, pointing to potential for a deeper correction.
XRP trades at $2.38, with momentum indicators suggesting possible further downside.
Bitcoin (BTC) struggles to regain bullish momentum, hovering around $107,800 on Monday after a 5.49% drop last week. Ethereum (ETH) slips below the key $4,000 level, hinting at further downside risks, while Ripple (XRP) also trades under pressure as momentum continues to weaken.
Bitcoin could correct toward $102,000 if it closes below key support
Bitcoin price faced rejection from the 50-day Exponential Moving Average (EMA) at $113,950 on Tuesday and declined 7.36% by Friday. However, BTC found support around the 61.8% Fibonacci retracement at $106,453 on Saturday and recovered by 2.22% the next day. At the time of writing on Monday, BTC hovers at around $108,700.
If BTC continues its price correction and closes below the $106,453 support, it could extend the decline toward the October 10 low of $102,000.
The Relative Strength Index (RSI) on the daily chart reads 40, below the neutral level of 50, indicating bearish momentum gaining traction. Moreover, the Moving Average Convergence Divergence (MACD) also showed a bearish crossover on October 11, which remains in effect, further supporting the bearish view.
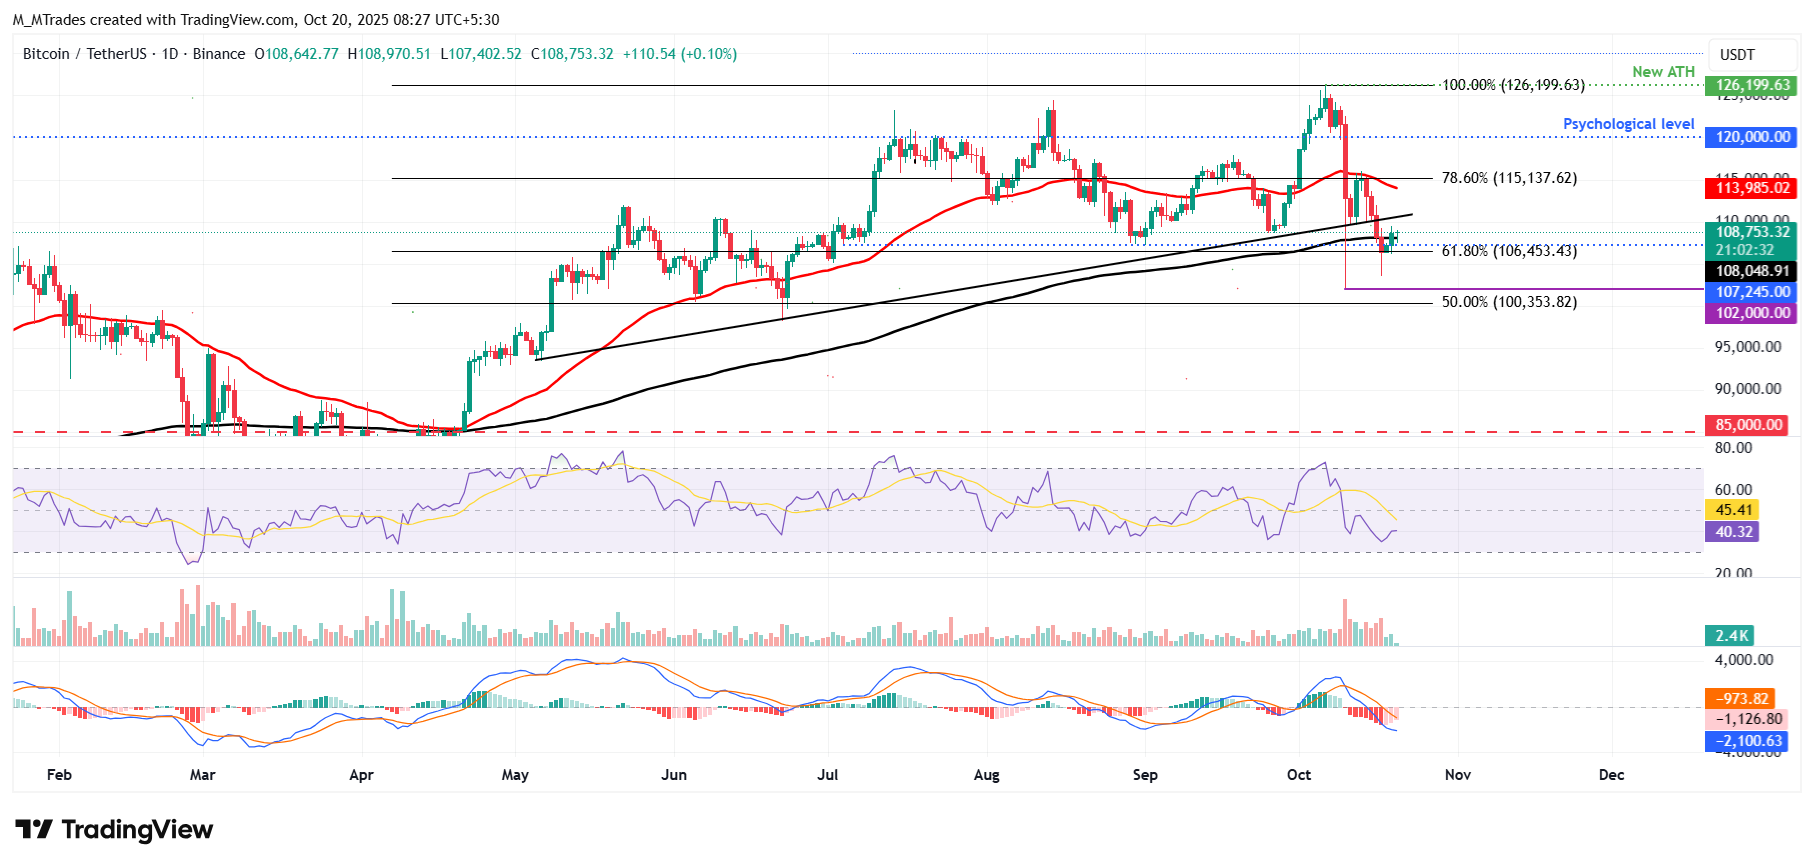
BTC/USDT daily chart
However, if BTC recovers, it could extend the recovery toward the previously broken trendline at around $110,000.
Ethereum shows weakness in momentum
Ethereum price corrected over 4% last week after facing rejection from the daily resistance at $4,232. At the start of this week on Monday, it hovers at around $3,953.
If ETH continues its downward momentum, it could extend the decline toward the 61.8% Fibonacci retracement level at $3,593, which coincides with the 200-day EMA.
Like Bitcoin, Ethereum’s RSI and MACD indicators also support the bearish view.
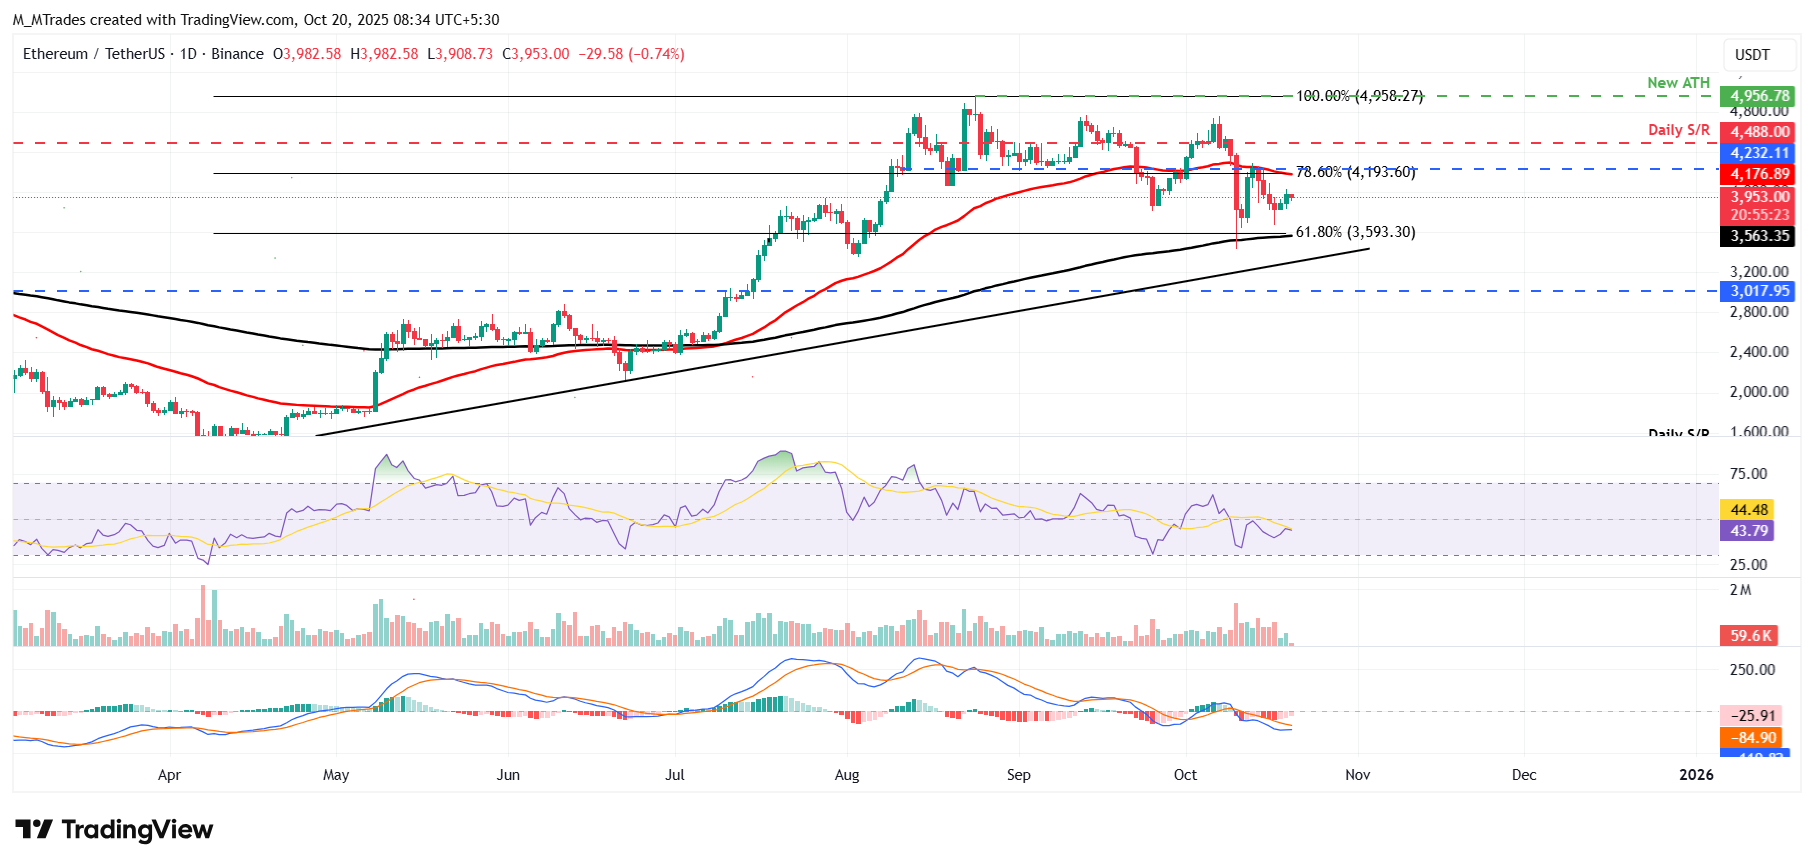
ETH/USDT daily chart
However, if ETH recovers, it could extend the recovery to retest its daily resistance level at $4,232.
XRP bears are in control of the momentum
XRP price corrected more than 5% last week after facing resistance around the lower trendline of a falling wedge pattern. At the time of writing on Monday, it hovers at around $2.38.
If XRP continues its downward trend, it could extend the decline toward the next daily support at $1.96.
Like Bitcoin and Ethereum, XRP’s momentum indicators, RSI and MACD, also support the bearish view.
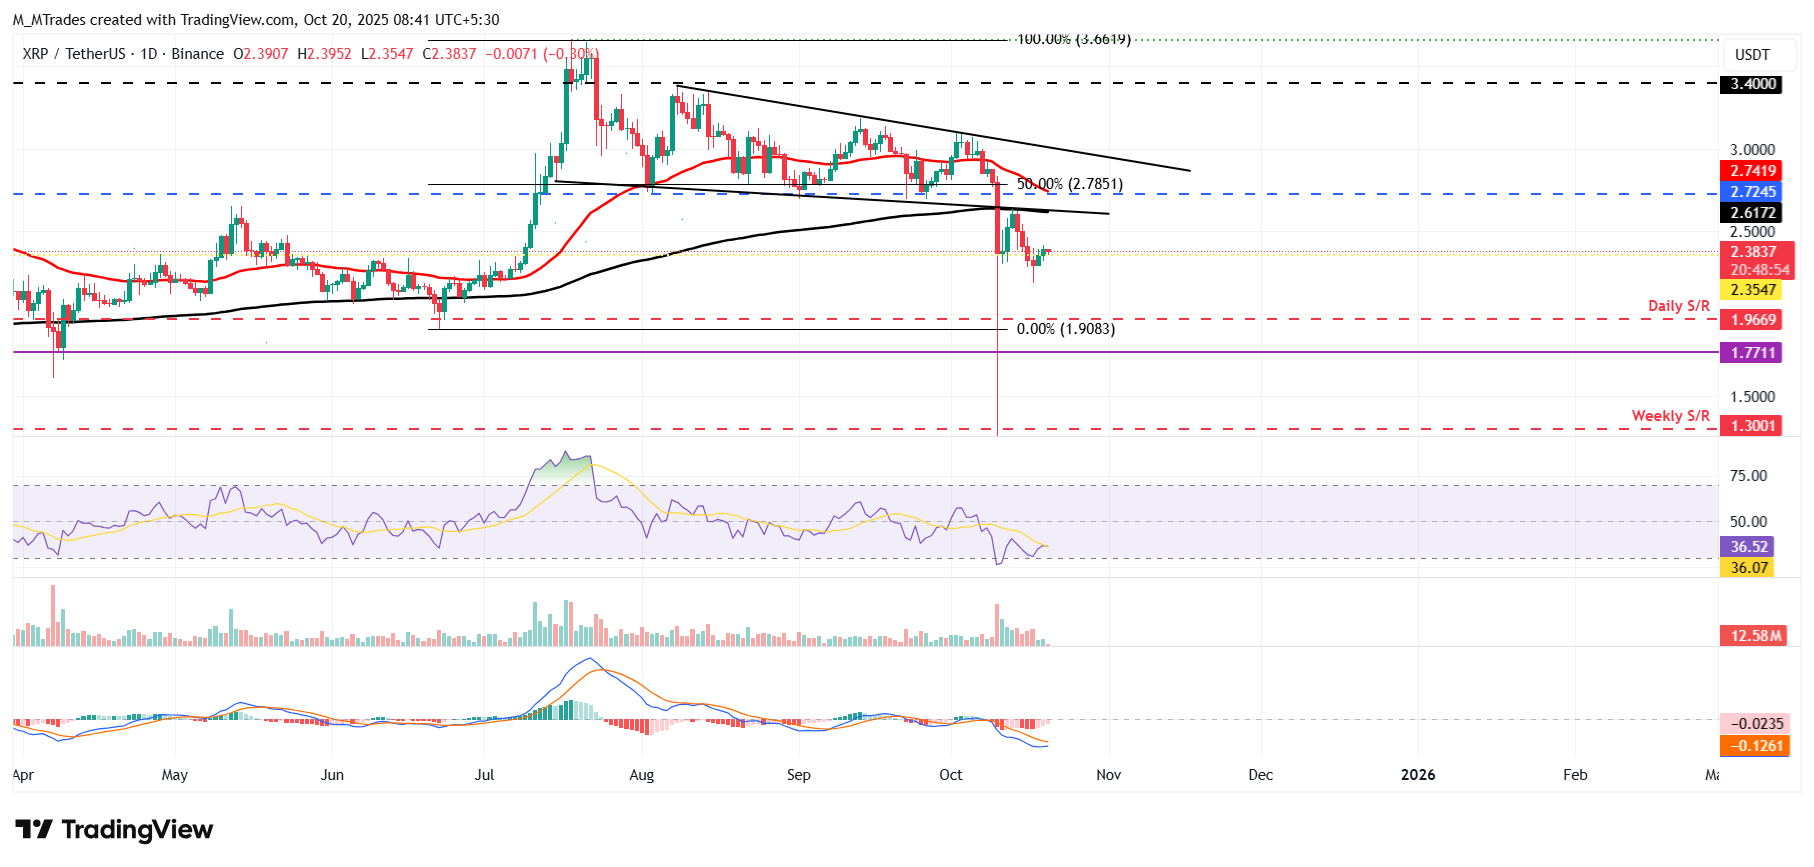
XRP/USDT daily chart
On the other hand, if XRP recovers, it could extend the recovery toward the 200-day EMA at $2.61.
Read more
* The content presented above, whether from a third party or not, is considered as general advice only. This article should not be construed as containing investment advice, investment recommendations, an offer of or solicitation for any transactions in financial instruments.


