

Top 3 Price Prediction: BTC, ETH and XRP flash weak momentum, raising risks of deeper pullbacks

- Trump Blockade of Strait of Hormuz Drives Oil Price Surge, Will This Be Another TACO?
- When Will Gold Rise Under the Pressure of High Oil Prices?
- Silver Price Forecasts: XAG/USD approaches $78.00 boosted by Iran peace hopes
- Nasdaq Index Rises for 10 Straight Days, Why Has Tesla Barely Risen?
- WTI jumps roughly 8% toward $100 as US blockades Strait of Hormuz
- WTI holds steady above $92.00 as Strait of Hormuz remains closed; bulls seem hesitant

Bitcoin price is nearing its key level at $116,000, a breakdown could extend the losses.
Ethereum price fails to close above its resistance at $4,488, hinting at a correction ahead.
XRP tests support at $2.99, as weakening momentum indicators point to a potential pullback.
Bitcoin (BTC), Ethereum (ETH), and Ripple (XRP) are showing signs of weakness as momentum fades across the broader crypto market. BTC and XRP are hovering near the critical $116,000 and $2.99 supports, respectively, while ETH struggles to break above $4,488 resistance. Meanwhile, the momentum indicators of all the top 3 cryptocurrencies are hinting at the risk of a deeper pullback.
Bitcoin could extend its decline if it closes below $116,000 support level
Bitcoin price reached a new all-time high of $124,474 on Thursday but failed to maintain its upward strength and declined 4% on the same day. BTC hovered around the $117,300 level during the weekend. At the start of this week, on Monday, it trades slightly down, nearing its key support at $116,000.
If BTC closes below its daily support at $116,000, it could extend the decline to retest its 50-day Exponential Moving Average (EMA) at $115,031. A successful close below this level could extend the losses toward its next support level at $111,980.
The Relative Strength Index (RSI) on the daily chart slips below its neutral level of 50 and points downward, indicating bearish momentum gaining traction. The Moving Average Convergence Divergence (MACD) also showed a bearish crossover on Sunday, giving sell signals and suggesting a downward trend ahead.
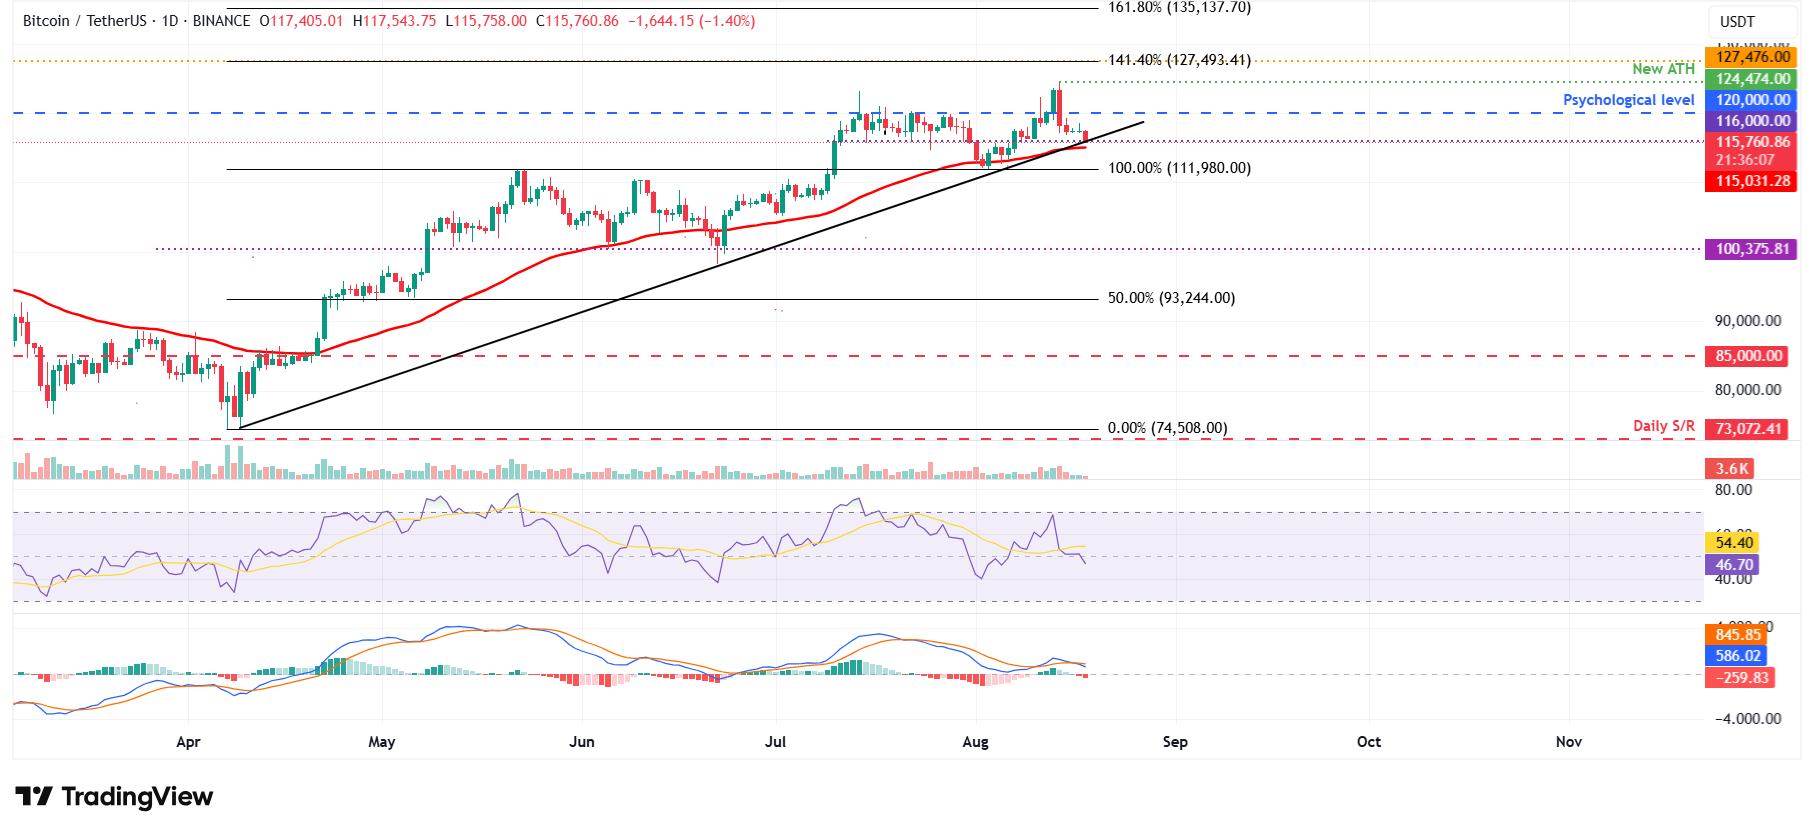
BTC/USDT daily chart
However, if BTC finds support around the daily level of $116,000, it could extend the recovery toward its psychological level of $120,000.
Ethereum is set for a correction
Ethereum price reached a new yearly high of $4,788 on Thursday, inching closer to its record high of $4,486, but failed to continue its upward trend and declined nearly 7% by Saturday. On Sunday, it recovered slightly but was rejected from its daily level at $4,488. At the time of writing on Monday, it continues to trade down at around $4,364.
If ETH continues to face a pullback, it could extend the decline toward its next key support at $3,946.
The RSI on the daily chart reads 62, rejecting from overbought territory last week and pointing downward, indicating fading bullish momentum.
The MACD lines converge and are about to flip to a bearish crossover, further supporting the bearish thesis.
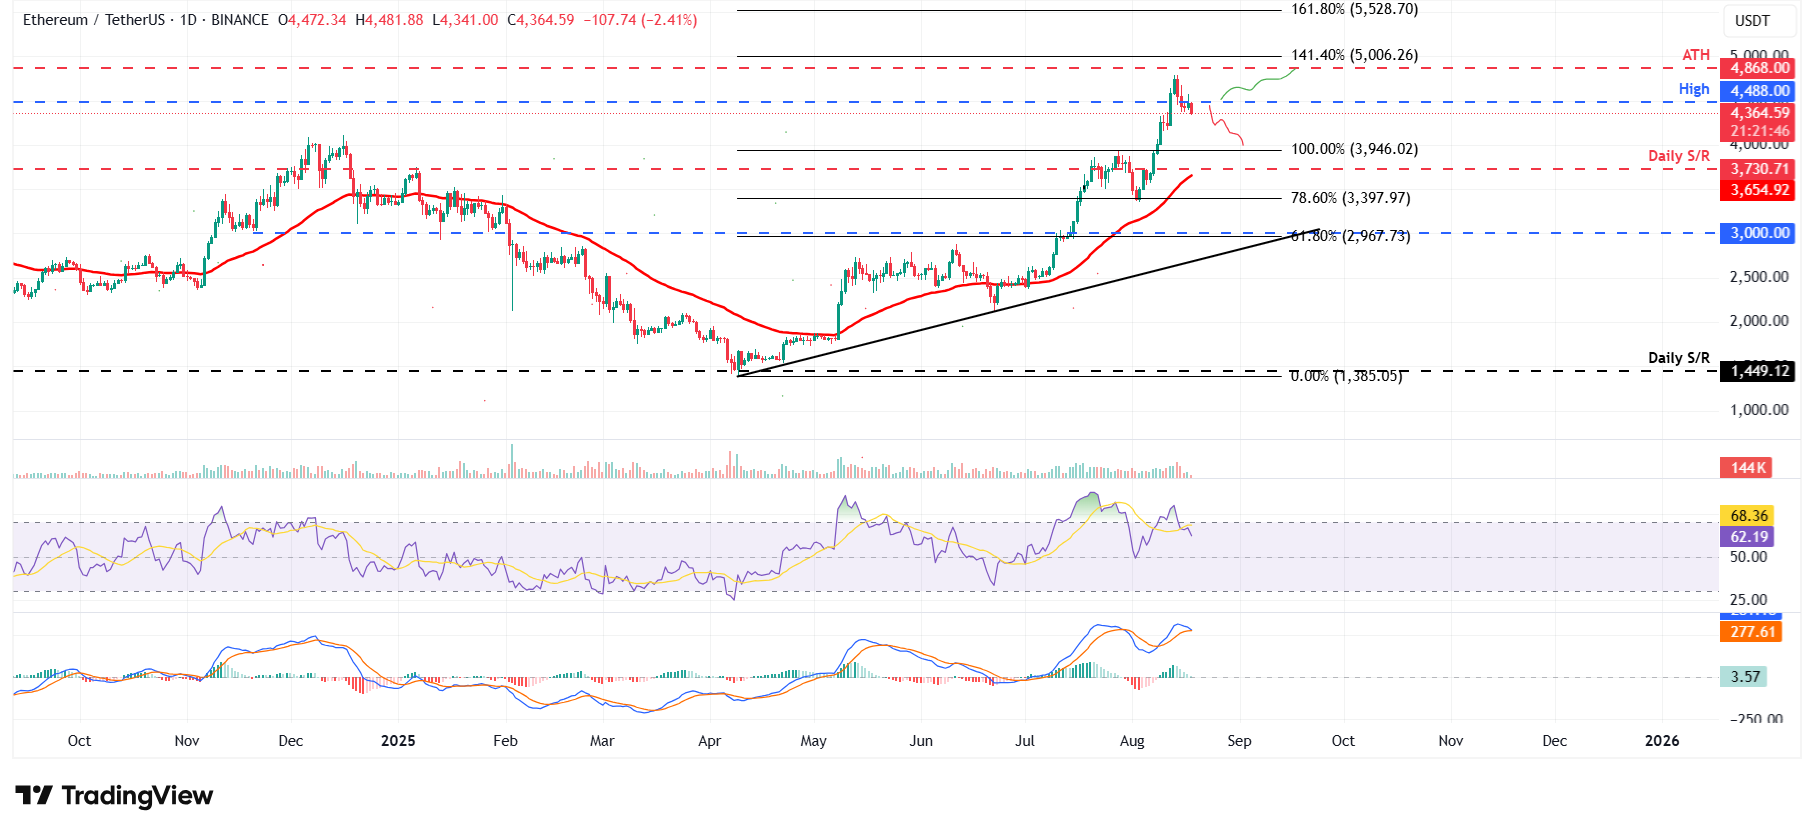
ETH/USDT daily chart
On the other hand, if ETH recovers and closes above the daily resistance at $4,488, it could extend the rally toward its record highs at $4,868.
XRP’s momentum indicators show signs of weakness
Ripple’s XRP faced rejection around the daily level of $3.40 on Thursday and declined nearly 6% until Sunday. At the time of writing on Monday, it continues to trade down, nearing its key support at $2.99.
If XRP closes below its support at $2.99, it could extend the decline toward its next support level at $2.72.
Like BTC, XRP’s momentum indicators, RSI and MACD, also support the bearish thesis.
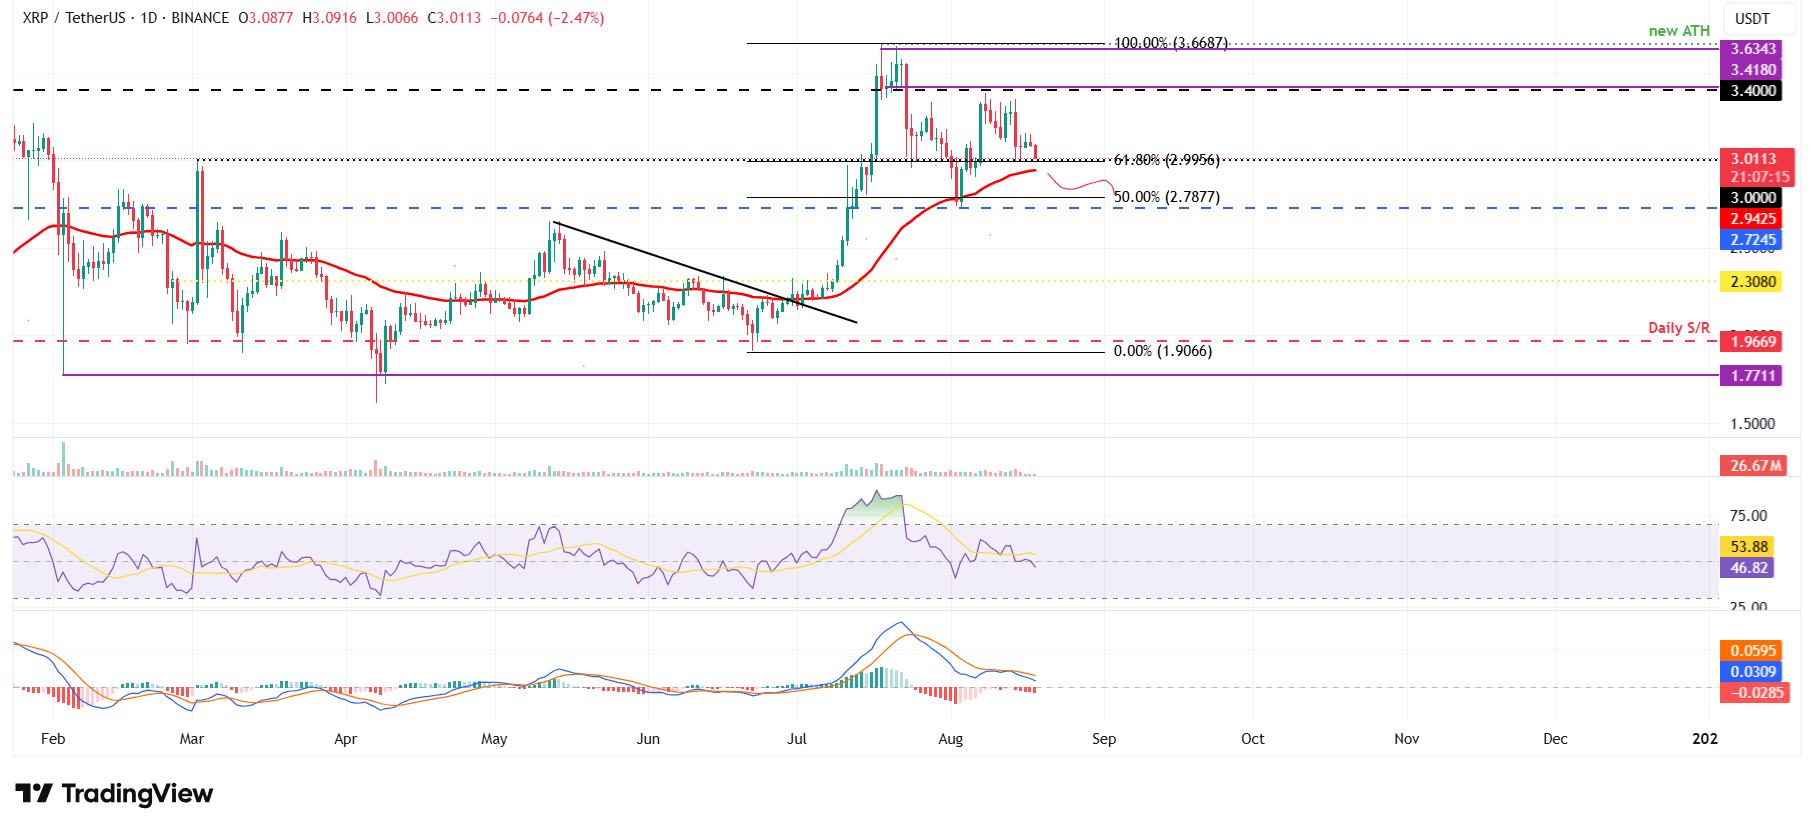
XRP/USDT daily chart
Conversely, if XRP finds support around its $2.99, it could extend the recovery toward its daily level at $3.40.
Read more
* The content presented above, whether from a third party or not, is considered as general advice only. This article should not be construed as containing investment advice, investment recommendations, an offer of or solicitation for any transactions in financial instruments.


