
Top 3 Price Prediction: Bitcoin, Ethereum, Ripple – BTC steadies after record high, ETH and XRP eye rebound

- Fed Chair Candidate: What Would a Hassett Nomination Mean for U.S. Stocks?
- After the Crypto Crash, Is an Altcoin Season Looming Post-Liquidation?
- The 2026 Fed Consensus Debate: Not Hassett, It’s About Whether Powell Stays or Goes
- AUD/USD holds steady below 0.6550 as traders await Australian GDP release
- AUD/USD sticks to gains above 0.6600, highest since late October after Aussie trade data
- AUD/USD holds steady above 0.6600; remains close to two-month high ahead of US PCE data

Bitcoin holds near $118,700 on Friday after hitting an all-time high of $124,474 before Thursday’s pullback.
Ethereum finds support around $4,488, hinting at a potential recovery.
Ripple’s XRP drops to test the $2.99 key level, with bulls eyeing a rebound.
Bitcoin (BTC), Ethereum (ETH), and Ripple (XRP) stabilized around their key support levels on Friday after dipping 4%, 4.26%, and 5.96%, respectively, the previous day. This price pullback in the top 3 cryptocurrencies came in after the US Producer Price Index (PPI) data was released by the Bureau of Labor Statistics (BLS) on Thursday. The PPI figures significantly exceeded economists’ expectations, suggesting that inflation is gradually escalating in the US, which has caused a risk-off sentiment in the market.
Bitcoin faces a pullback after record highs
Bitcoin price reached a new all-time high of $124,474 on Thursday but failed to maintain the upward momentum and declined 4% on the same day. At the time of writing on Friday, it trades at around $118,900.
If BTC holds above the $116,000 support level, it could extend the rally to its record high of $124,474.
The Relative Strength Index (RSI) reads 54, above its neutral level of 50, indicating bulls still have room for upward momentum. The Moving Average Convergence Divergence (MACD) indicator showed a bullish crossover on Monday, giving a buy signal.
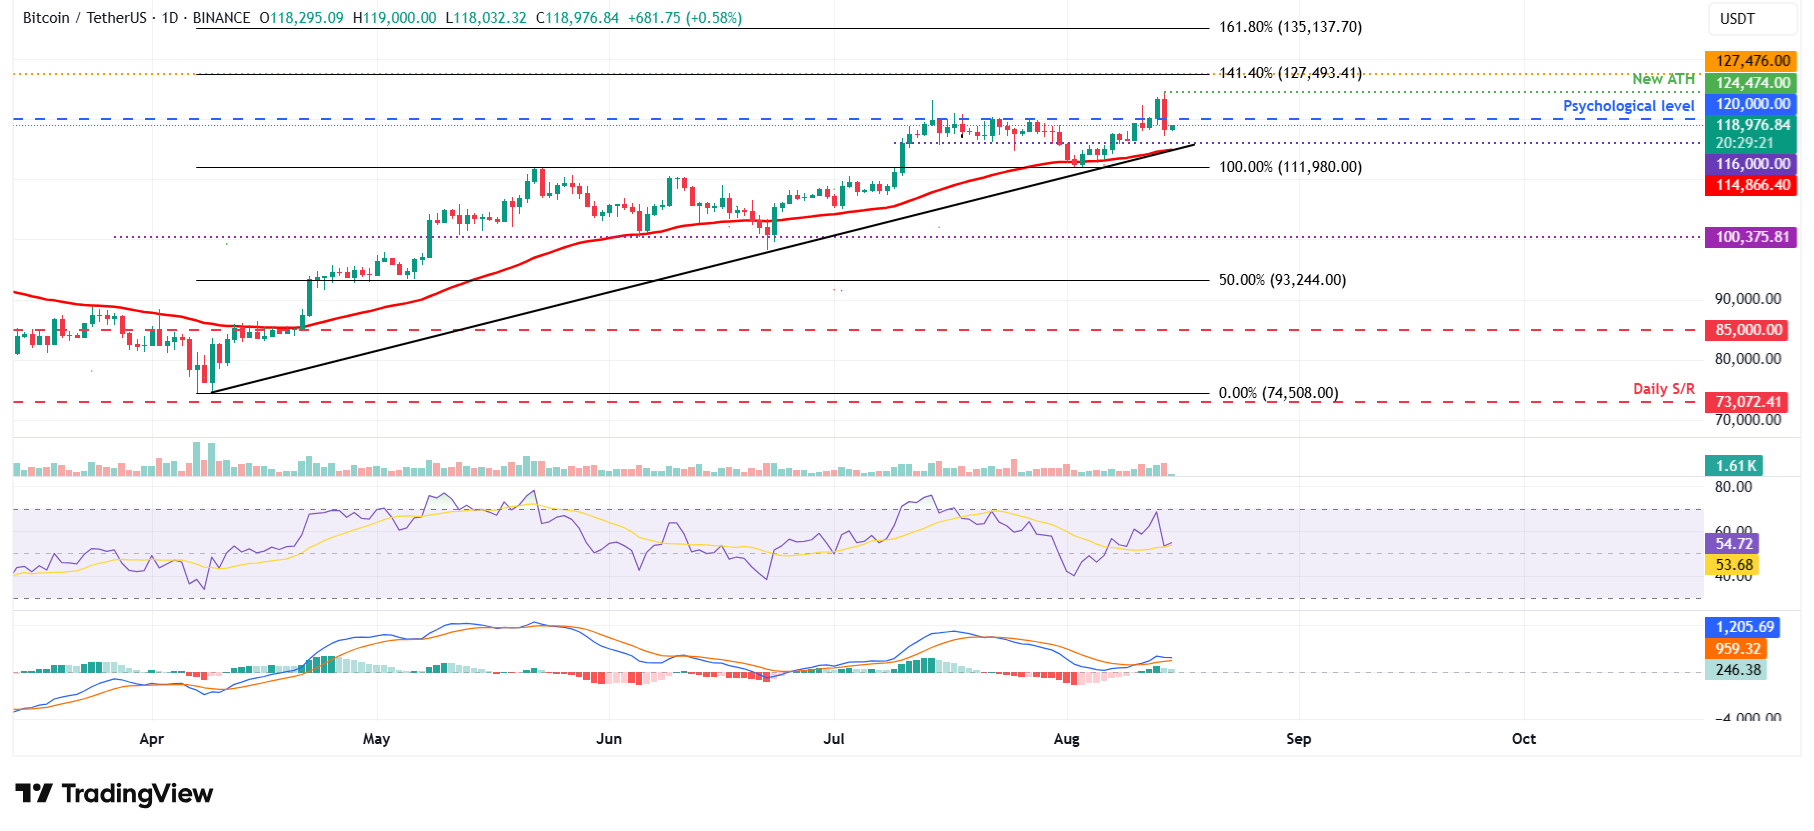
BTC/USDT daily chart
However, if BTC closes below its $116,000 support on a daily basis, it could extend the decline toward the next key support $111,980.
Ethereum price inches away from record highs
Ethereum price reached a new yearly high of $4,788 on Thursday, reaching a level not seen since December 1, 2021, and inches away from its record high of $4,868. However, it failed to maintain these gains and declined 4.26% on that day. At the time of writing on Friday, it has recovered slightly to around $4,624.
If ETH holds above $4,488 support level and continues its recovery, it could extend the rally toward its record high of $4,868, set on November 10, 2021.
The RSI on the daily chart reads 72, bouncing above its overbought level of 70, pointing above, indicating strong bullish momentum. The MACD showed a bullish crossover on Saturday, and with rising green histogram bars, further supports the bullish thesis.
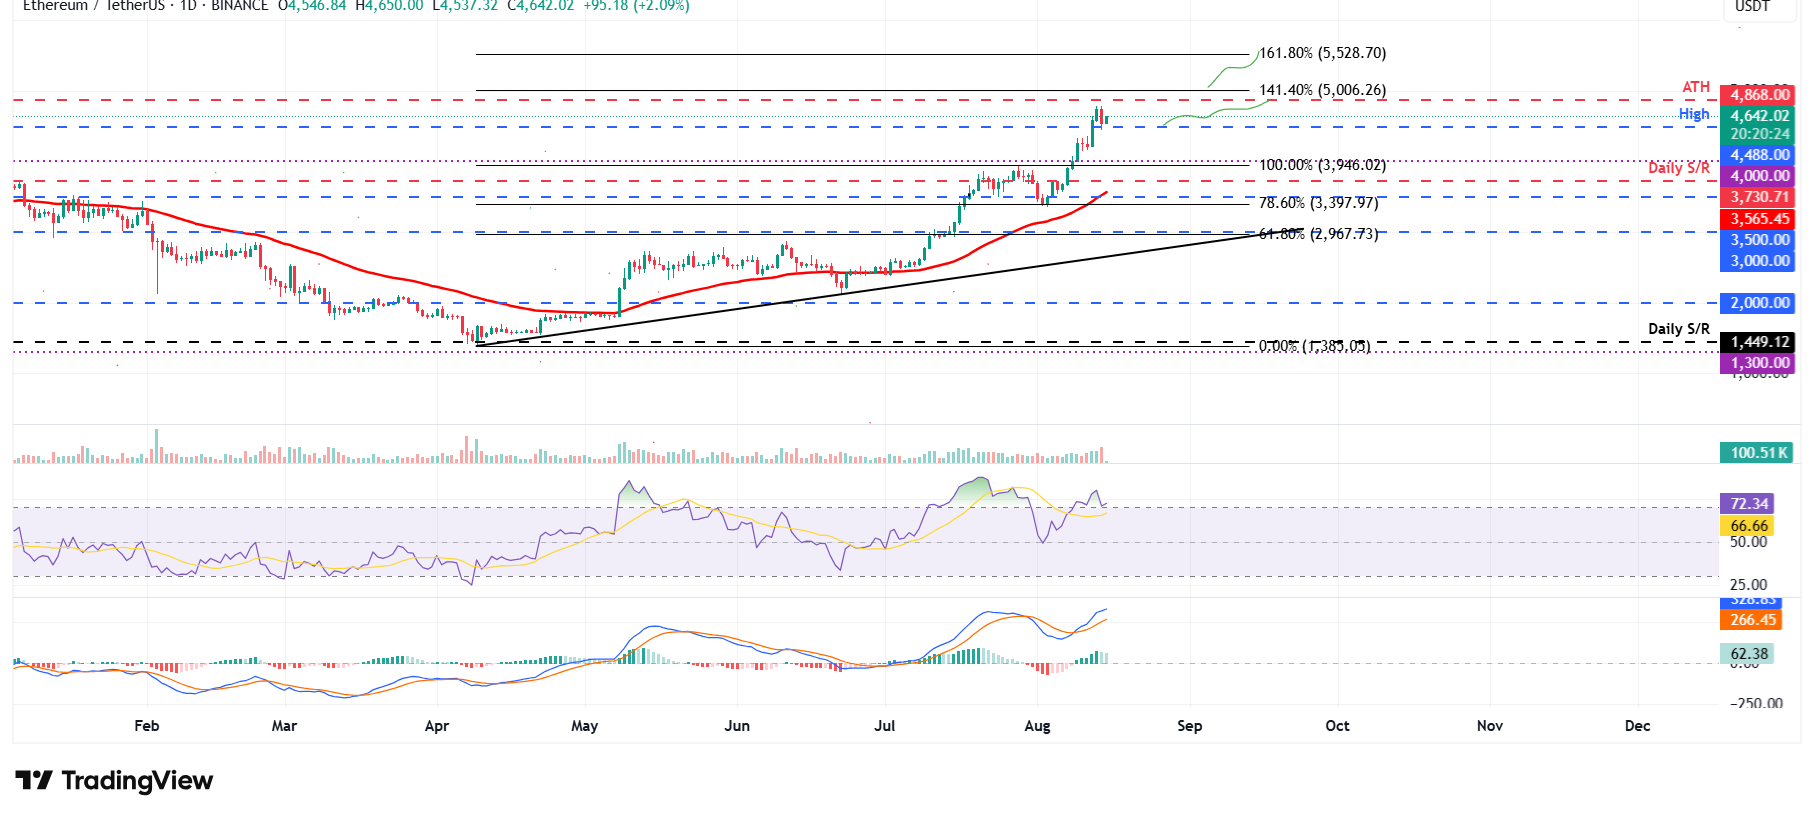
ETH/USDT daily chart
If ETH faces a correction, it could extend the decline to find support around $3,946.
XRP finds support around the key level
XRP price faced rejection from its daily level around $3.40 on Thursday and declined 5.96% for the day, testing its key support at $2.99. At the time of writing on Friday, it recovers slightly, trading around $3.11.
If XRP holds above the $2.99 support level, it could extend the rally toward its next daily resistance at $3.40.
The RSI on the daily chart reads 51, above its neutral level of 50, indicating fading bearish momentum. For the recovery rally to be sustained, the RSI must continue to move above its neutral value. Traders should still be cautious that the MACD shows a bearish crossover on Thursday, giving sell signals and suggesting a downward trend.
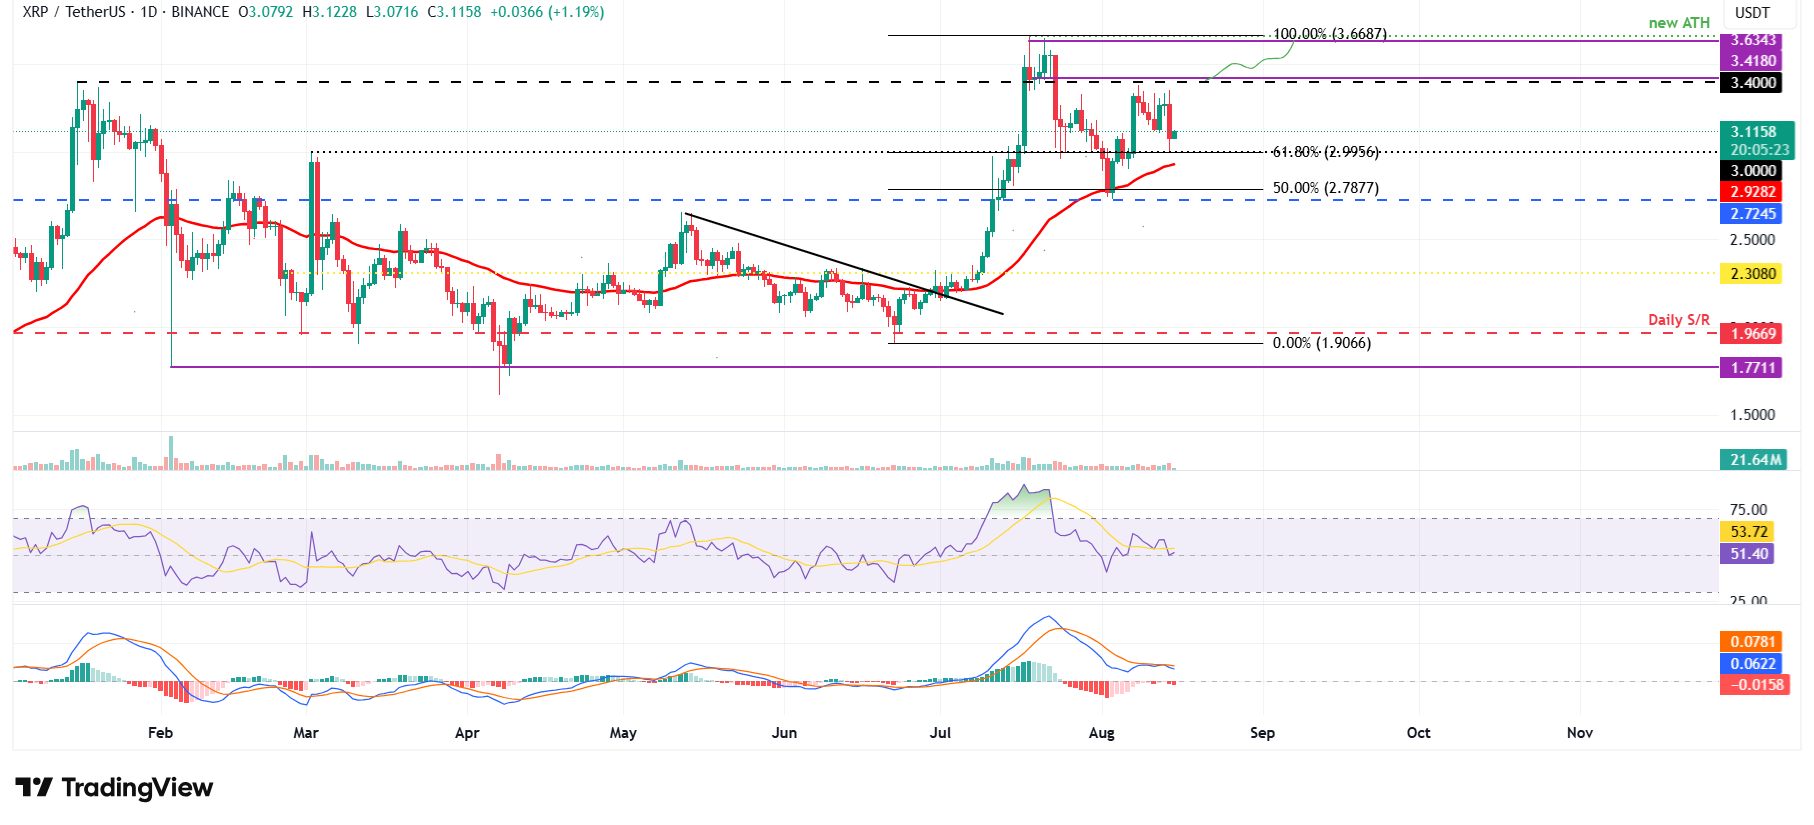
XRP/USDT daily chart
However, if XRP closes below its $2.99 support level, it could extend the decline toward its next support at $2.72.
Read more
* The content presented above, whether from a third party or not, is considered as general advice only. This article should not be construed as containing investment advice, investment recommendations, an offer of or solicitation for any transactions in financial instruments.


